
The news of the beginning of the week was monopolized by the US presidential election. During the last few months, a lot of interactive maps flourished on the internet showing the tendencies in the polls. This gave me the idea to make my own interactive maps!
It seems the data per county for the 2016 election are not yet freely available. So I did an election map of the … 2012 presidential election. This article is about the creation of such a map using OpenSource tools: QGIS, PostGIS, Geoserver and OpenStreetMap.
Note: This web application is not online as I do not have the infrastructure to host it.
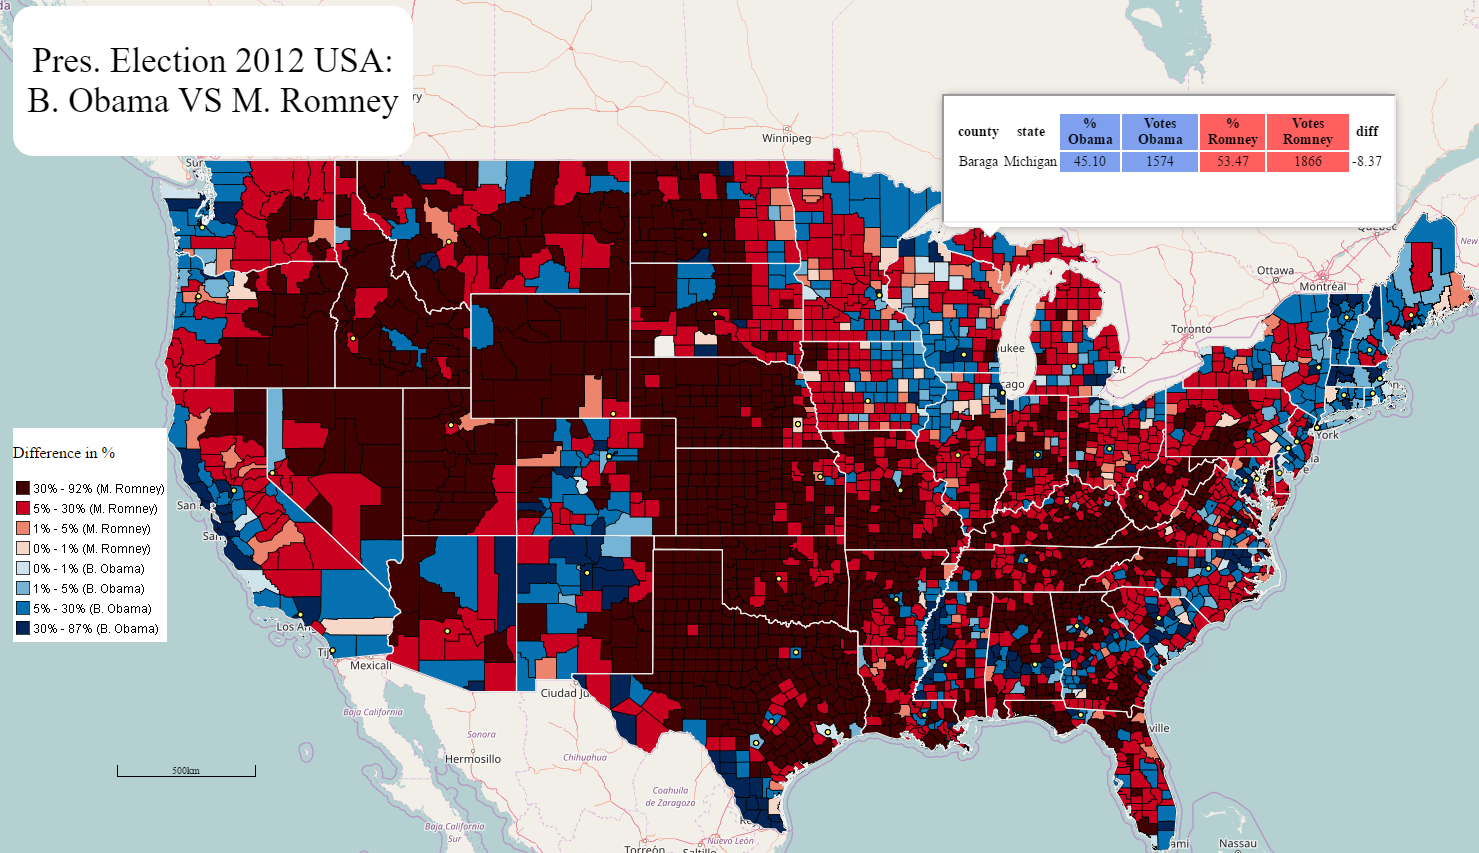
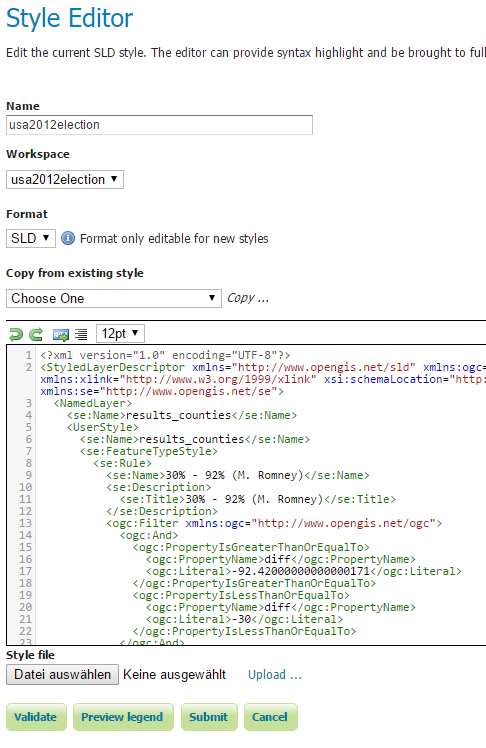
The symbology represents the different in percentage between the vote going to Barack Obama VS Mitt Romney. The light colour counties show where there is an almost tie. The redder the county, the more vote for the Republican Nominee vs the Democrate, and vice-versa with blue.
Get the data
The first step is to get the data. The dataset I found comes from the Guardian website.
The Excel file is rather raw and needs to be cleaned up.
There are two sheets in this Excel file. The first shows the direct confrontation between Barack Obama and Mitt Romney. Strangely, some states, such as Colorado, are not covered. The second sheet of the document contains all the US counties and the votes for every candidate, even for Colorado. That means, third party candidates are also listed but we want to focus only of the two major actors of this election: Barack Obama and Mitt Romney. The Excel sheet has thus to be cleaned!
Clean the data
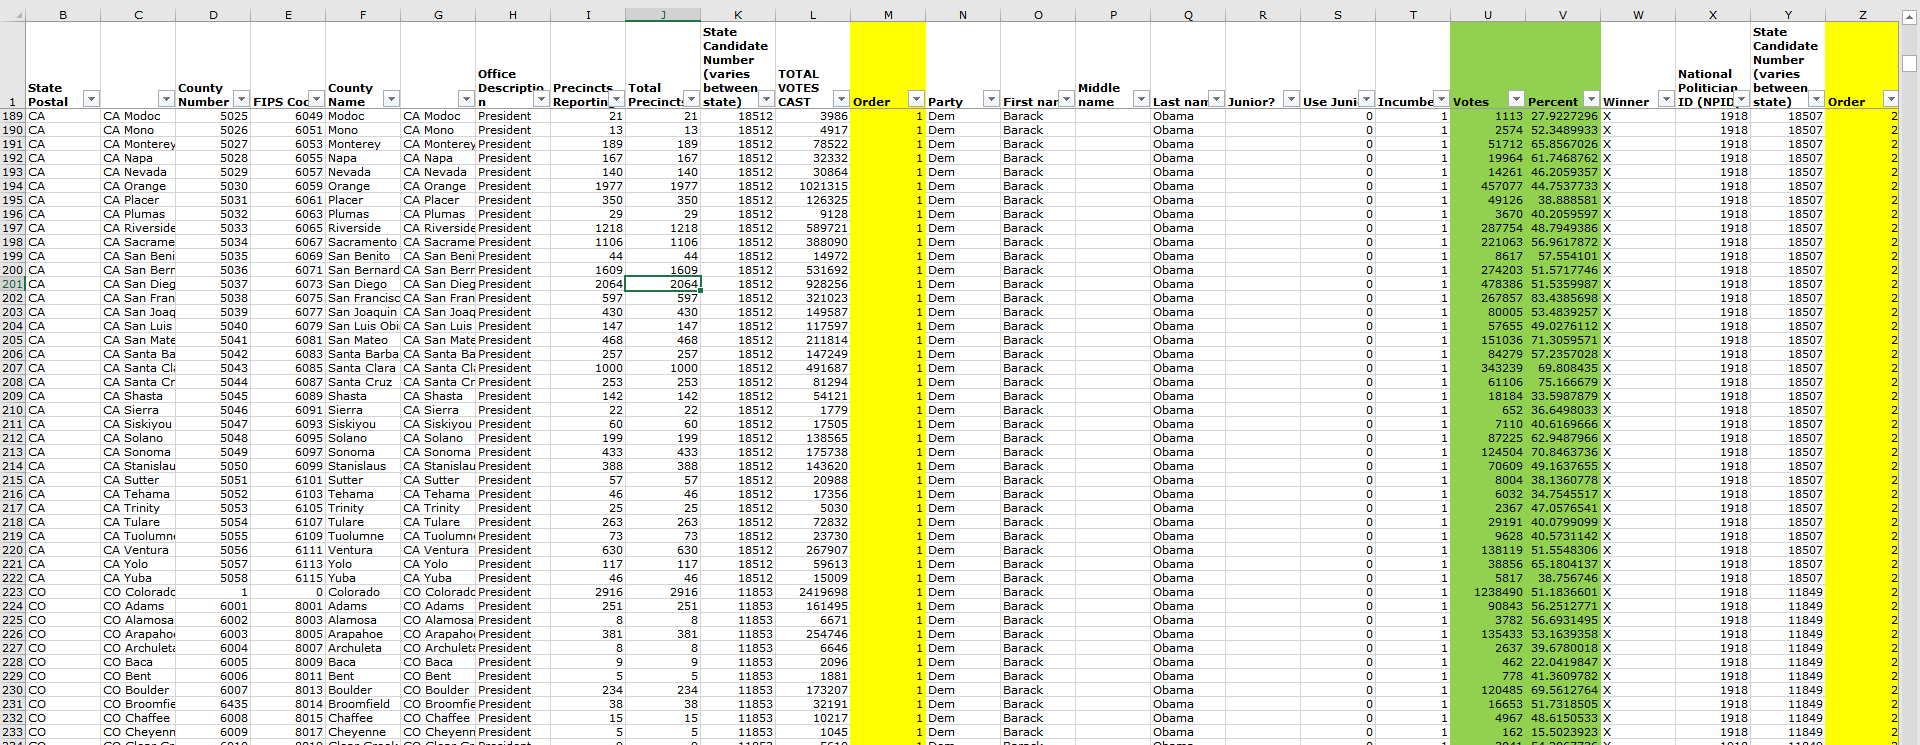
The way I approached this problem is the following: I only need information about the county, the total votes and the percentage for Barack Obama and for Mitt Romney. A concatenate formula helps me with creating INSERT scripts. Here’s one of the 4639 scripts:
INSERT INTO results(state_postal, county_name, fips, obama_vote, obama_percent, romney_vote, romney_percent, total_votes) VALUES ('CA', 'San Bernardino', 6071, 274203, 51.5717746364437, 245468, 46.1673299579456, 531692);
Data Loading and preparation
As of always, we’re using an underlying PostGIS database to store and manage the data.
Our database is called usa2012election we’re loading first three geographic layers: one for the counties, one for US States and one for the biggest cities. All of them are freely available on the ArcGIS platform. The data loading is performed using the shp2pgsql tool.
shp2pgsql -s4326 -c -ggeom -I "[...]\COUNTIES.shp" public.counties | psql -U<user> -h<ip>-dusa2012election
shp2pgsql -s4326 -c -ggeom -I "[...]\cb_2015_us_state_500k.shp" public.states | psql -U<user> -h<ip>-dusa2012election
shp2pgsql -s4326 -c -ggeom -I "[...]\USCITIES.shp" public.cities | psql -U<user -h<ip> -dusa2012election
A lot of information is unnecessary in the county table. We clean all the fields we are not interested in.
ALTER TABLE counties DROP COLUMN pop_sqmi , DROP COLUMN pop2010 , DROP COLUMN pop10_sqmi , [...];
ALTER TABLE cities DROP COLUMN gid, DROP COLUMN class, DROP COLUMN st, DROP COLUMN stfips, [...];
DELETE FROM cities WHERE population < 100000 AND capital IS NULL;
The table containing the data from the Excel sheet is created here. We call it “results”;
DROP TABLE results;
 CREATE TABLE results (
 id serial PRIMARY KEY,
 state_postal varchar(2),
 county_name varchar(20),
 fips numeric(5),
 obama_vote float,
 obama_percent float,
 romney_vote float,
 romney_percent float,
 vote_balance float,
 total_votes numeric(7)
 );
We can now execute the whole bunch of insert scripts we created in the Excel file.
INSERT INTO results (state_postal, county_name, fips, obama_vote, obama_percent, romney_vote, romney_percent, total_votes) VALUES (‘WV’, ‘Wood’, 54107, 11067, 32.9375, 21980, 65.4166666666667, 33600);
INSERT INTO results (state_postal, county_name, fips, obama_vote, obama_percent, romney_vote, romney_percent, total_votes) VALUES (‘WV’, ‘Wyoming’, 54109, 1575, 21.0112059765208, 5751, 76.7209178228389, 7496);
INSERT INTO results (state_postal, county_name, fips, obama_vote, obama_percent, romney_vote, romney_percent, total_votes) VALUES (‘WY’, ‘Wyoming’, 0, 68780, 27.9838069857803, 170265, 69.2739589478609, 245785);
INSERT INTO results (state_postal, county_name, fips, obama_vote, obama_percent, romney_vote, romney_percent, total_votes) VALUES (‘WY’, ‘Albany’, 56001, 7445, 46.3805133316721, 7851, 48.9097931721904, 16052);
[…]
The FIPS, the field that identifies uniquely every county, is not of the same data type in the tables results and county. It must be as we’ll do a join between both tables! The FIPS in the results table is converted from integer to varchar.
ALTER TABLE results ALTER COLUMN fips TYPE varchar(5) USING cast(fips AS varchar(5));
The FIPS in the geometric table are of type varchar and contains a leading zero. We have to make sure they don’t so they can be joined with the results table. Only the States in the beginning of the alphabet have a leading zero as FIPS..
UPDATE counties SET fips = LTRIM(fips, '0') WHERE
state_name = 'Alaska' OR state_name = 'Alabama' OR
state_name = 'Arkansas' OR state_name = 'Arizona' OR
state_name = 'California' OR state_name = 'Colorado' OR
state_name = 'Connecticut' OR state_name = 'District of Columbia' OR
state_name = 'Delaware';
We perform, finally, our join between both tables. We store the result in a view we will later use in Geoserver.
DROP VIEW results_counties;
 CREATE VIEW results_counties AS SELECT c.name County, c.state_name State,
round(cast(r.obama_percent as numeric), 2) "% Obama",
round(cast(r.obama_vote as numeric)) "Votes Obama",
round(cast(r.romney_percent as numeric), 2) "% Romney",
round(cast(r.romney_vote as numeric)) "Votes Romney",
round(cast(r.vote_balance as numeric), 2) "% diff",
c.geom FROM counties c JOIN results r ON c.fips = r.fips;
Notice how we round the values so the reading will be more comfortable in the web app.
Configure Geoserver
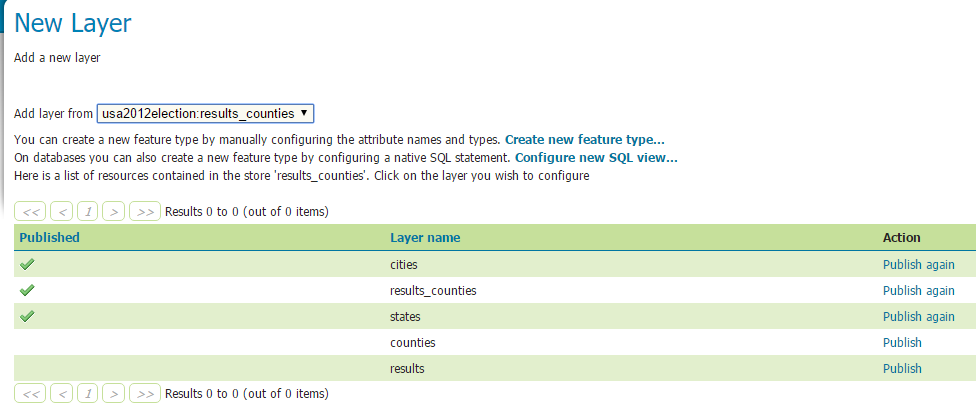
The idea is to server the data via Geoserver. Here are the steps
- Create a workspace, we call it usa2012election
- Create a store
- Add our two layers (states and cities) and our view (results_counties)
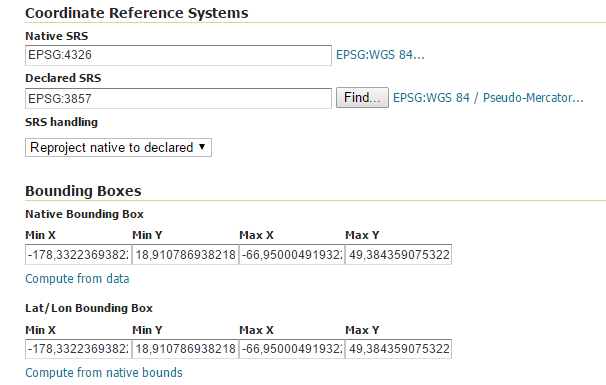
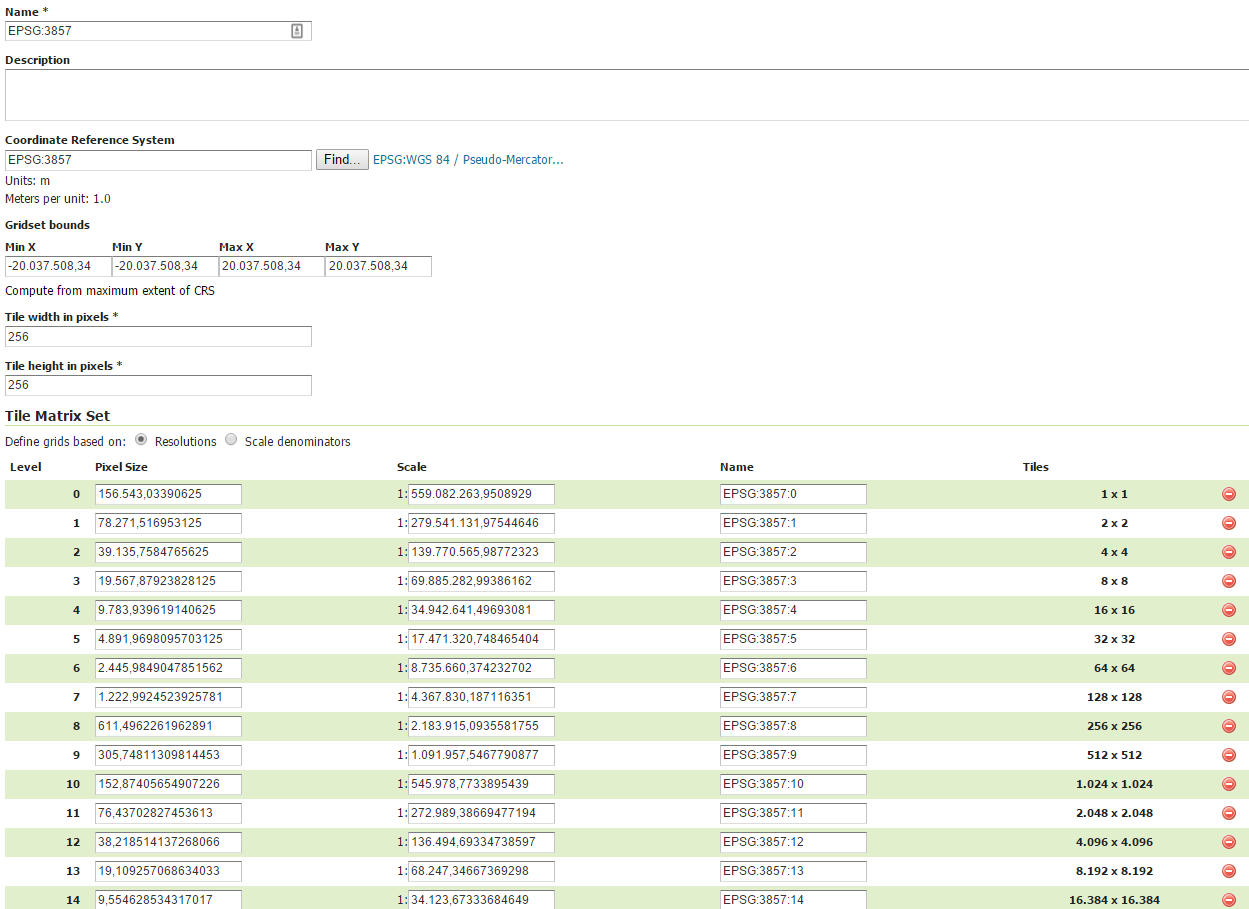
For the configuration of the layer, pay attention to the SRS! Our original data is in 4326, and we need 3857 as it is the default one used in OpenLayers 3! The other reason is that we will use an OpenStreetMap Background as thus only 3857 is accepted.
The styles are in SLD format and were created in QGIS. The three SLD files, one for each layer and the view, are appended.
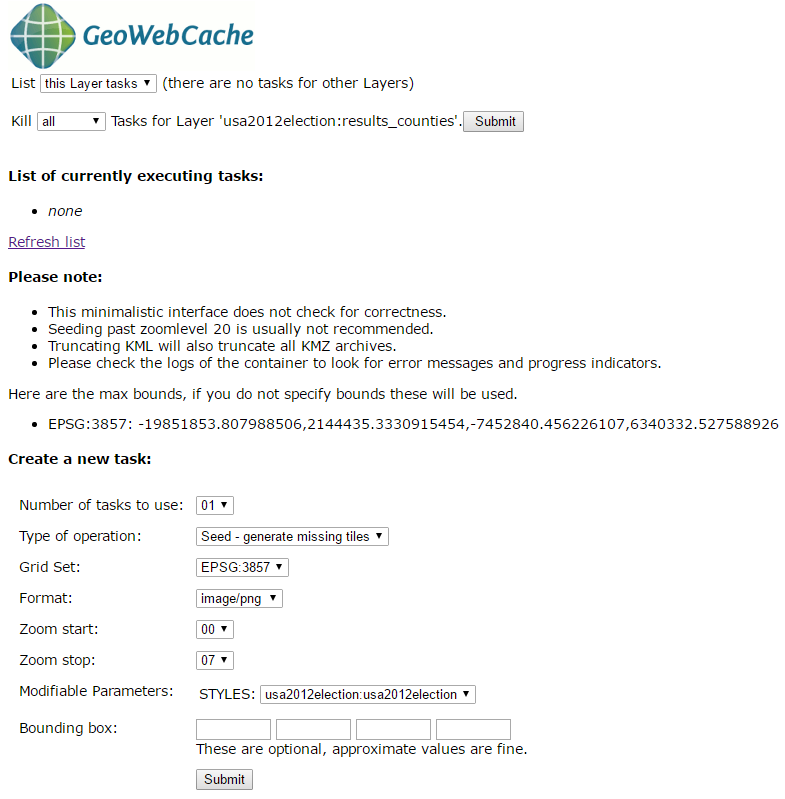
Last but not least, we need our application to be performant (of course)! The step here is to defined Tile Caches. This is mandatory in our case as the County layer is quite heavy and takes somes seconds to load. This is not good.
Create first an EPSG 3857 Gridset
Then, generate the tiles for each of the layers.
OpenLayers 3 Client Development
The final part is configuring the Web client using OpenLayers 3.
The first step is quite basic we the definition of our html file. Three parts here: the map, the title bar and the legend.
<!DOCTYPE html>
 <html>
 <head>
 <title>USA 2012 ELECTION</title>
 <meta charset="utf-8">
 <link href="css/ol.css" rel="stylesheet">
 <link href="css/usa2012election.css" rel="stylesheet">
 </head>
 <body>
 <div id="title">
 <p>Pres. Election 2012 USA: B. Obama VS M. Romney</p>
 </div>
 <div id="legend">
 <p>Legend</p>
 <img src="[...]/geoserver/usa2012election/ows?service=WMS&request=GetLegendGraphic&format=image%2Fpng&width=20&height=20&layer=results_counties&style=usa2012election">
 </div>
 <div id="map"></div>
 <div id="popup" class="ol-popup">
 <a href="#" id="popup-closer" class="ol-popup-closer"></a>
 <div id="popup-content"></div>
 </div>
 <script src="js/ol.js"></script>
 <script src="js/OpenLayers.js"></script>
 <script src="js/draw.js"></script>
 </body>
 </html>
Our three layers are added via this way.
var params = {
 LAYERS: 'usa2012election:cities',
 TRANSPARENT: 'false',
 FORMAT: 'image/png'
 };
cities = new ol.layer.Tile({
 source: new ol.source.TileWMS({
 url: '[...]/geoserver/gwc/service/wms?SRS=EPSG:3857',
 params: params
 })});
var params = {
 LAYERS: 'usa2012election:states',
 TRANSPARENT: 'false',
 FORMAT: 'image/png'
 };
states = new ol.layer.Tile({
 source: new ol.source.TileWMS({
 url: '[...]/geoserver/gwc/service/wms?SRS=EPSG:3857',
 params: params
 })});
 var params = {
 LAYERS: 'usa2012election:results_counties',
 TRANSPARENT: 'false',
 FORMAT: 'image/png'
 };
 result = new ol.layer.Tile({
 source: new ol.source.TileWMS({
 url: '[...]/geoserver/gwc/service/wms?SRS=EPSG:3857',
 params: params
 })});
Notice how we get the most of performances using the gwc application. It uses the caches we generated in Geoserver.
Finally, we add a phantom underlying layer which is only used for the GetFeatureInfo functionnality. It is called each time we click on the map to get the relevant information about how many people voted for who.
 var wmsSource = new ol.source.TileWMS({
 url: 'http://localhost:8080/geoserver/usa2012election/wms',
 params: {
 'LAYERS': 'usa2012election:results_counties'},});

var wmsLayer = new ol.layer.Tile({
 source: wmsSource});

map.on('singleclick', function(evt) {
 document.getElementById('popup').innerHTML = '';
 var viewResolution = (view.getResolution());
 var coordinate = evt.coordinate;
 var url = wmsSource.getGetFeatureInfoUrl(
 coordinate, viewResolution, 'EPSG:3857', {
 'INFO_FORMAT': 'text/html'
 });
 if (url) {
 document.getElementById('popup').innerHTML =
'<iframe width="450px" height="125px" border-width="0px"
border-radius:"200px" seamless src="' + url + '"></iframe>';
}
 overlay.setPosition(coordinate);});
Finally, add the layers to the map.
 map.addLayer(result);
 map.addLayer(states);
 map.addLayer(cities);
One last thing! The GetFeatureInfo returns pieces of information that are not necessary to the user. These are the fid and the id. For resolving this issue, we define a file called content.ftl in the Geoserver data folder. We will format the returning information to send to the user.
<table class="featureInfo">
 <caption class="featureInfo"></caption>
 <tr>
<#list type.attributes as attribute>
 <#if !attribute.isGeometry && attribute.name != "id">
 <th >${attribute.name}</th>
 </#if>
</#list>
 </tr>

<#assign odd = false>
<#list features as feature>
 <#if odd>
 <tr class="odd">
 <#else>
 <tr>
 </#if>
 <#assign odd = !odd>

<#list feature.attributes as attribute>
 <#if !attribute.isGeometry && attribute.name != "id">
 <td>${attribute.value}</td>
 </#if>
 </#list>
 </tr>
</#list>
</table>
<br/>
At last, wrap the all application in a very nice css and you got the result we observe in the short introductory video!
All the scripts are available here to reproduce at home!
I am now waiting the 2016 Presidential Election Results by Counties to make and publish an updated map!
Enjoy for recreating your own presidential election map!
Cheers,
Daniel