
To open The Magiscian Blog, I decided to talk you about an app whose is currently in all the newspaper: The World Cup in Brazil!
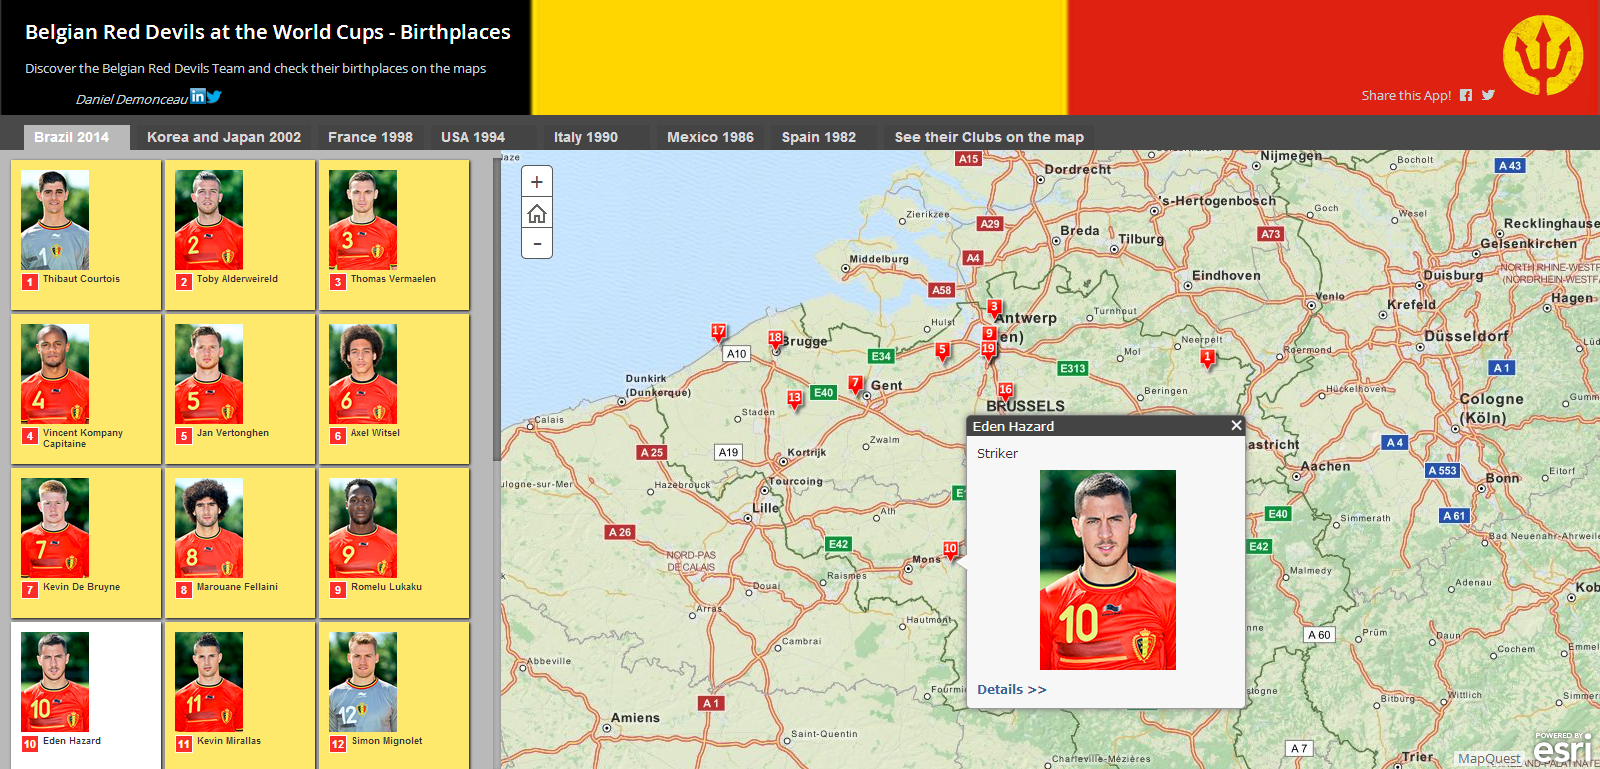
Being a Belgian, and supporting of course our Red Devils, I created a webapp of our national football teams in the last World Cups (1982 – 2014). The maps showed in this app spots the birthplaces of all the Red Devils and their clubs.
Feel free to discover the app!
This web application has been created using esri’s Story Map shortlist template http://storymaps.arcgis.com/en/app-list/shortlist/.
Here are the steps to create such kind of webapp:
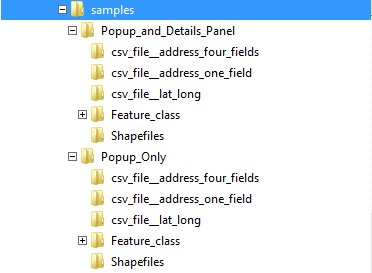
- First, download the wished Story Maps template for the Story Maps Website – I did choose the Shortlist one
- Select a data template – I did choose the Popup_and_Details_panel/csv_file__address_one_field. That means, My underlying data are stored in a csv file and the information will be displayed in a separate popup in my application
- Fill in the csv file with the information you want to show
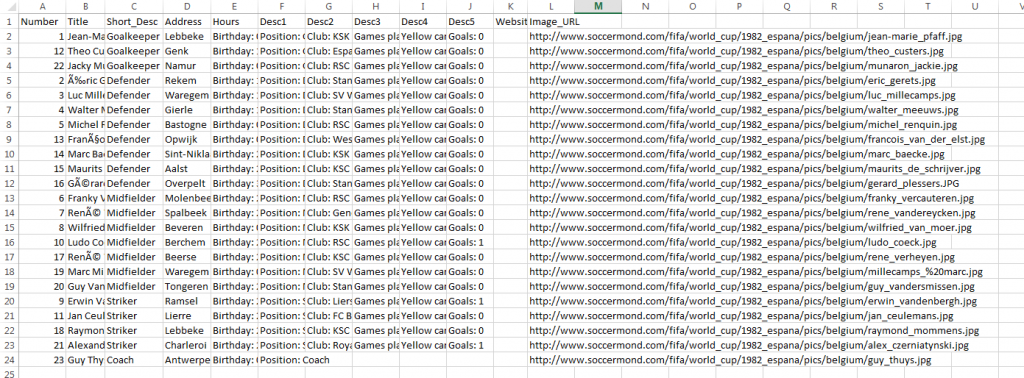
- In my application, I decided to show following information
- The player number (the coach has been assigned a 23)
- The name of the players
- The position on the Field
- The address -> the birthplaces used to spot the players on the map!
- The birthday and the age of the players
- The club the player was playing for
- Number of games played
- The number of yellow/red/yellow then red cards the players received during the tournament
- The number of goals
- A url of the picture of the player
- Do this step again for a layer where players are located based on the clubs they are playing for
- The information I used here comes all from Wikipedia. The advantage of doing so is that the information are already structure in a table and a simple copy/paste is enough to integrate the info in the csv file
- The picture of the players comes from http://www.soccermond.com/
- In my application, I decided to show following information
- Create an ArcGIS Online map on http://arcgis.com
- Simply add the csv file to the map via drag and drop from the File Explorer to the map
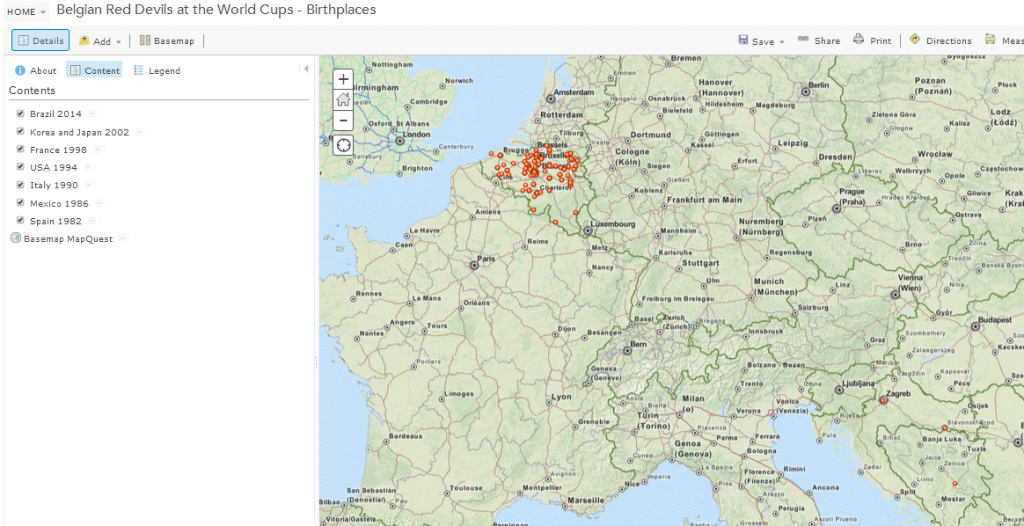
- Create a separate bookmark for every layer and give them the exacte same name as for the layer – This has to be done if you want the user to zoom on the layer extent while switching between the layers (and it adds also a drop-down list in the application)
- Save the map to create a Webmap
- In the address url of the map, copy the id of the map you just created

- Open the index.html file from the Shortlist App template you downloaded before and replace, in the config section, the map ID with the one of the map you just created
- Place the complete folder of the Shortlist application in an Application Server, open a browser, go to the application ET VOILÀ !
- Now, the last steps are the customization of the Story Map. That means, changing the banner, the colors and the theme in general, the copyright information, etc. – These information has to be update in the custom.css file in the application structure
Il manque Witsel 😉
Il est bien là, numéro 6 😉