
One of my hobbies beside GIS is following the Stock Market, whether it is the Belgian BEL20, the French CAC40, the Dutch AEX, the German DAX30 and of course the two American Dow Jones and NASDAQ.
The idea of this article was to merge both hobbies: The Stock Market and GIS. As a Belgian, my interest focuses on the BEL20 which is composed of following companies:
| Company | Sector | Address |
|---|---|---|
| AB InBev | Brewers | Boulevard Industriel 21 1070 Brussels |
| Ackermans & van Haaren | Diversified Industrials | Begijnenvest 113 B-2000 Antwerp |
| Ageas | Life Insurance | Markiesstraat 1 1000 Brussel |
| Befimmo-Sicafi | Industrial and Office REITs | Parc Goemaere Chaussée de Wavre 1945 B-1160 Brussels |
| Bekaert | Diversified Industrials | President Kennedypark 18 8500 Kortrijk |
| Belgacom | Telecommunications | Koning Albert II laan 27B 1030 Brussel |
| bpost | Postal Service | E.M.C. Building 829 C 1931 Zaventem |
| Cofinimmo | Industrial and Office REITs | Bld de la Woluwe 58 Woluwedal 1200 Brussels |
| Colruyt Group | Food Retailers and Wholesalers | Edingensesteenweg 196 1500 Halle |
| D'Ieteren | Consumer Services | Rue du Mail 50 1050 Ixelles |
| Elia | Electricity | Boulevard de l'Empereur 20 1000 Bruxelles |
| GBL | Specialty Finance | Avenue Marnix n°24 1000 Brussels |
| GDF Suez | Gas Distribution | Boulevard Simon Bolivar 1000 Ville de Bruxelles |
| Groupe Delhaize | Food Retailers and Wholesalers | Osseghemstraat 53 1080 St Jans-Molenbeek |
| Groupe Delta Lloyd | Insurances | Avenue de l'Astronomie 23 1210 Bruxelles |
| KBC | Banks | Havenlaan 2 B – 1080 Brussels |
| Solvay | Specialty Chemicals | RUE DE RANSBEEK 310 1120 BRUXELLES |
| Telenet Group | Broadcasting and Entertainment | Liersesteenweg 4 2800 Mechelen |
| UCB | Pharmaceuticals | Allée de la Recherche 60 1070 Anderlecht |
| Umicore | Specialty Chemicals | Broekstraat 31 1000 Brussel |
Obsiously, the companies are put on a map based on their addresses. To do the geocoding, I used the HERE geocoding API. The data used for producing the maps are coming from Google Finance and lecho.be. Data have been gathered on Sunday the 26th of April (so data are still outdated when writing this article).
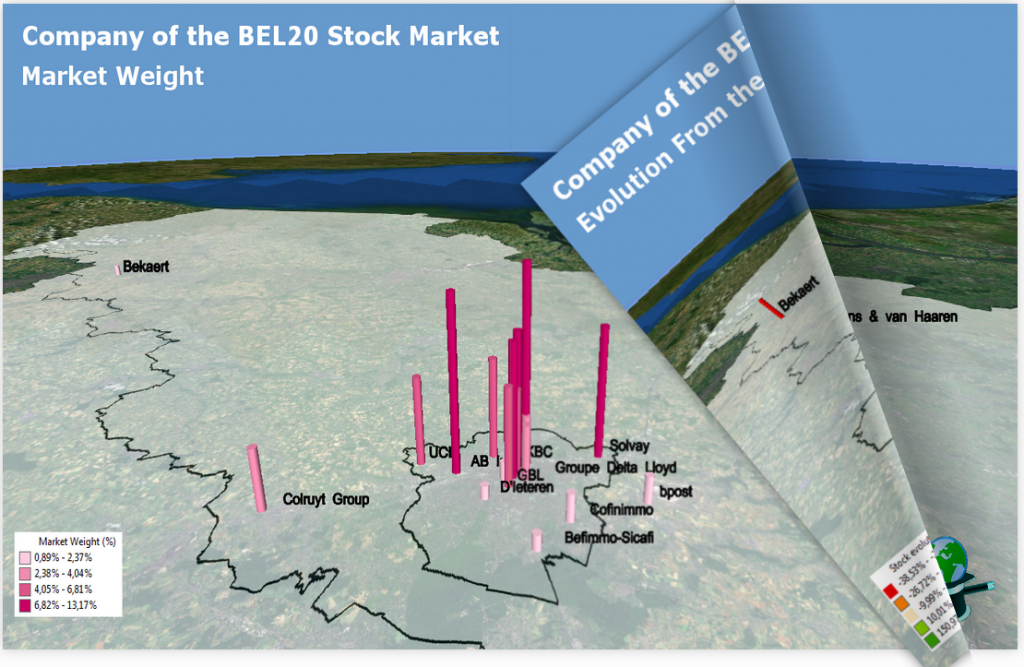
All the maps I did can be visualized in the bel20 Stock Market Index Book (CLICK ON THE PICTURE):
The maps were created within ArcGIS for Desktop. For each address point, I create a buffer with the purpose to extrude it according to a specific value. The document is then exported to ArcGlobe for giving the 3D perspective. The circles are extruded according to the parameters I chose:
- Market Weight
- Market Capitalization
- Stock Evolution the last 5 years
- Average Daily Volume
- Earning Per Share in Euro
- P/E Ratio
- Percentage Change from Year Low
- Percentage Change from Year High
As you will see in the following maps, the companies being part of the BEL20 index are principally located in Brussels. 5 of them are Flemish.
IMPORTANT NOTICE: This Article about combining GIS and the Stock Market has no purpose to give advise on buying or selling positions. This article is only an informative blog.
Here More Details about the individual maps:
Weight in the bel20 Index
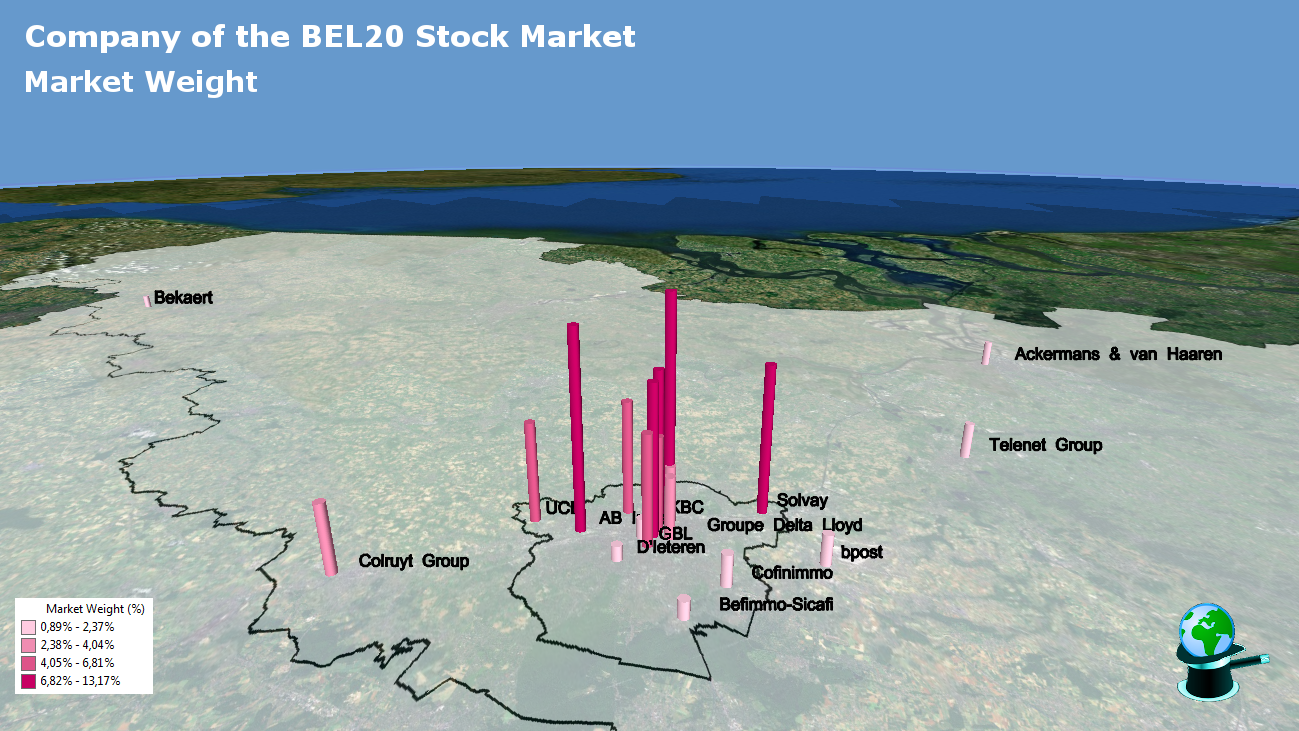
| Company | GDF Suez | AB InBev | KBC | Solvay | Ageas | Groupe Delhaize | GBL | UCB | Umicore | Colruyt Group | Groupe Delta Lloyd | Belgacom | Telenet Group | Ackermans & van Haaren |
|---|---|---|---|---|---|---|---|---|---|---|---|---|---|---|
| Weight | 13.17% | 11.66% | 8.94% | 8.94% | 8.90% | 6.81% | 6.52% | 5.97% | 5.74% | 4.04% | 3.68% | 3.63% | 2.37% | 2.07% |
As we see from the map, but as well from the table, the winners are GDF Suez, AB Inbev, KBC, Solvay and AGEAS. They are all located in the Brussels Region.
Market Capitalization
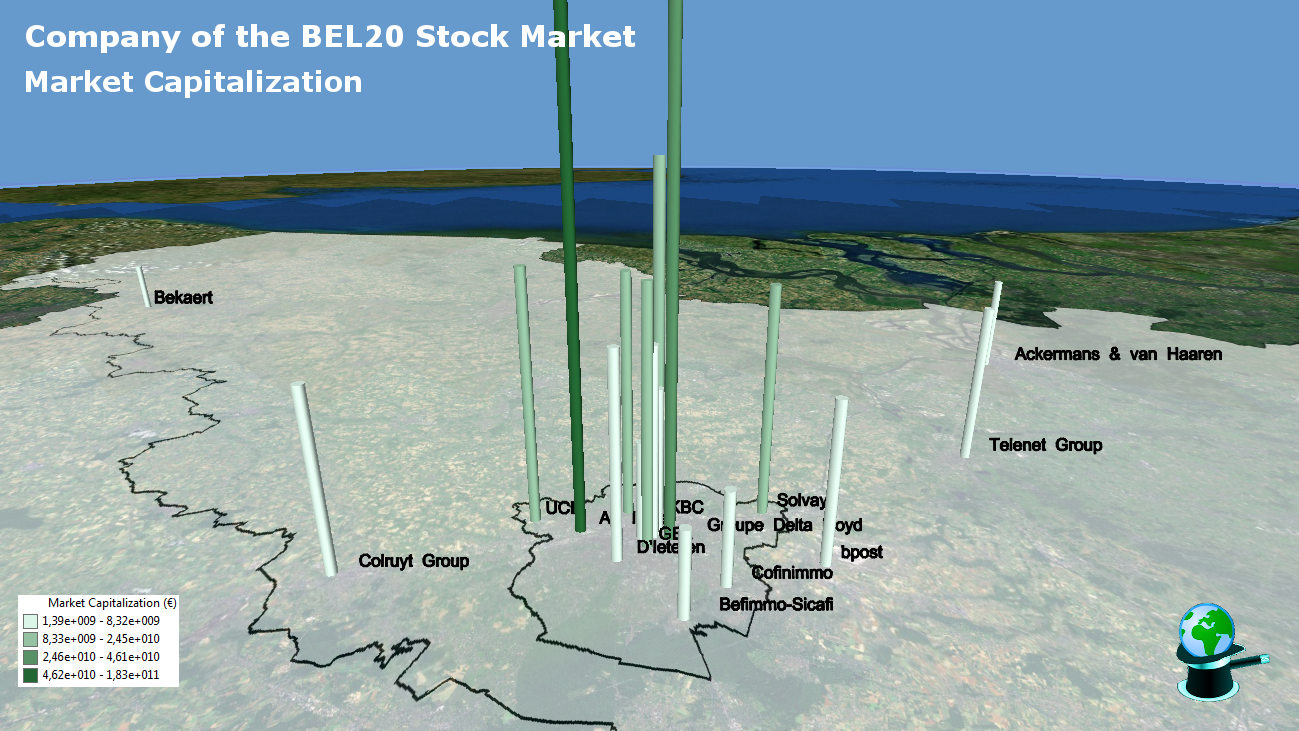
| Company | AB InBev | Groupe Delta Lloyd | KBC | UCB | GBL | Groupe Delhaize | Belgacom | Solvay | D'Ieteren | Ageas | Telenet Group | Colruyt Group | bpost |
|---|---|---|---|---|---|---|---|---|---|---|---|---|---|
| Market Cap in EURO | 182.60E+9 | 46.11E+9 | 24.46E+9 | 13.18E+9 | 12.91E+9 | 12.38E+9 | 11.45E+9 | 11.17E+9 | 8.32E+9 | 7.47E+9 | 6.49E+9 | 6.47E+9 | 5.23E+9 |
The map is not big enough to show the top of the tubes of AB Inbev, and Delta Lloyd.
Stock Evolution since 5 years
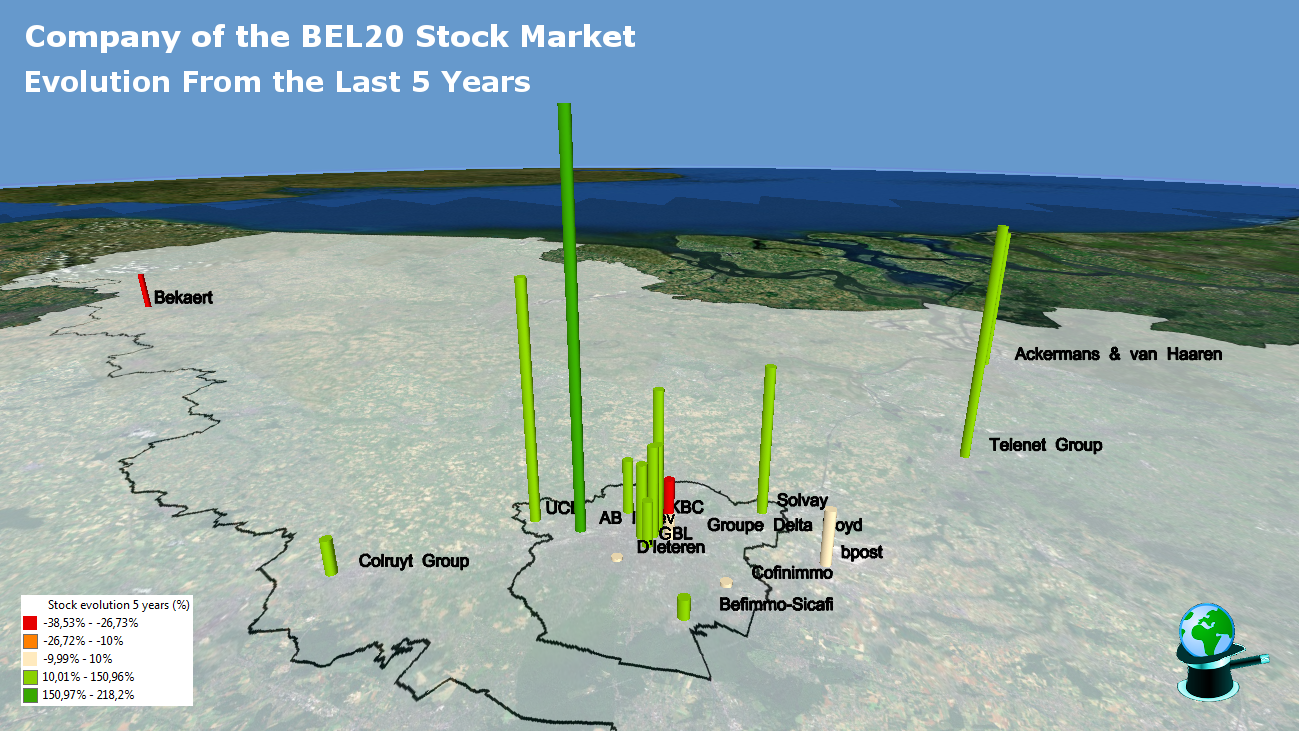
| Company | AB InBev | Telenet Group | UCB | Ackermans & van Haaren | Solvay | KBC | Ageas | Umicore | Elia | Groupe Delhaize | bpost | GBL | Colruyt Group |
|---|---|---|---|---|---|---|---|---|---|---|---|---|---|
| Stock evolution 5y | 218.20% | 150.96% | 137.99% | 117.33% | 88.08% | 78.09% | 53.37% | 52.71% | 43.66% | 32.65% | 31.55% | 26.85% | 19.81% |
The winner over the last 5 years is clearly AB Inbev which rose by 218%!. Telenet, UCB and Ackermans complete the closed club of companies which shares rose by more than 100%. On the other half of the table, we see clear loser like Bekaert (-38%) and GDF Suez (-26,73%).
Avery Daily Volume
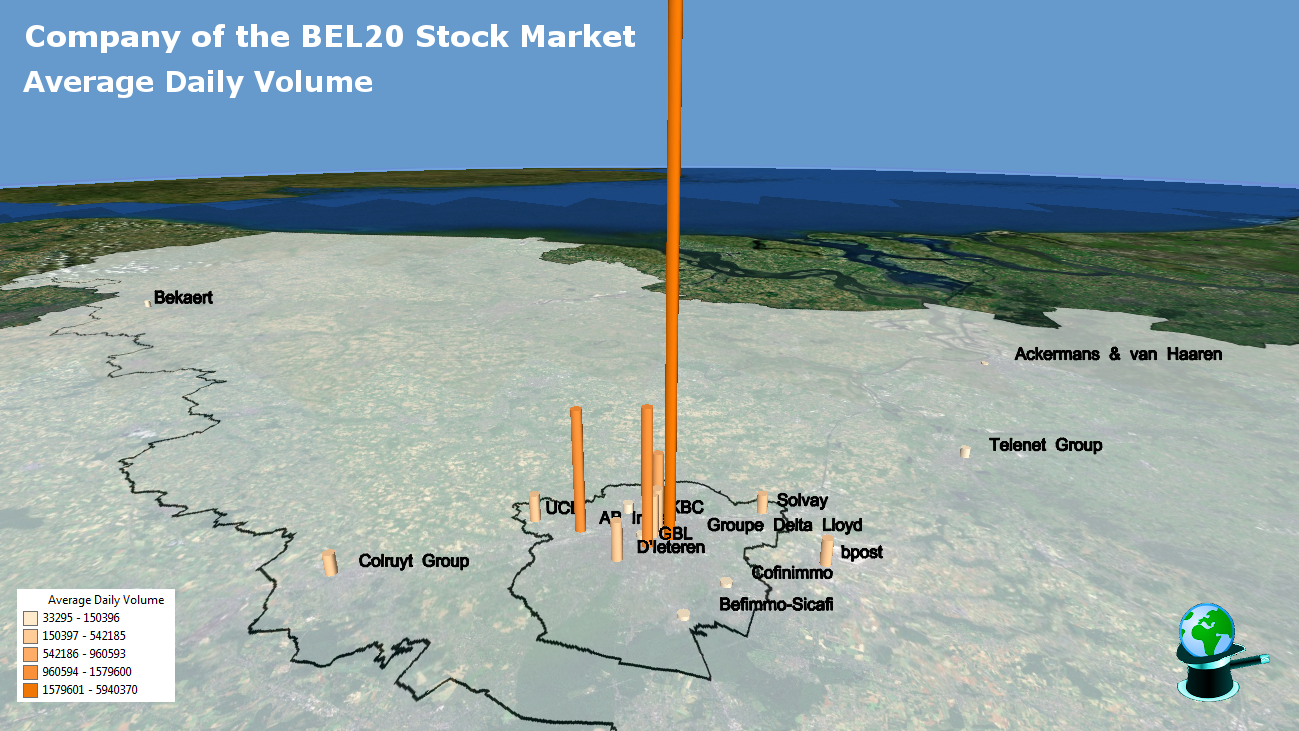
| Company | Groupe Delta Lloyd | GBL | AB InBev | Belgacom | KBC | Umicore | Ageas | D'Ieteren | UCB | bpost | Solvay | Colruyt Group | Bekaert | Telenet Group |
|---|---|---|---|---|---|---|---|---|---|---|---|---|---|---|
| Average daily volume | 5940370 | 1579600 | 1433190 | 960593 | 819744 | 542185 | 502054 | 456197 | 322835 | 302956 | 237677 | 234338 | 150396 | 127494 |
The belgian market is clearly monopolized by the Delta Lloyd for which an average of almost 6 million shares changes hand within the day. This is 4 times higher than the second in the list, GBL.
Earning Per Share
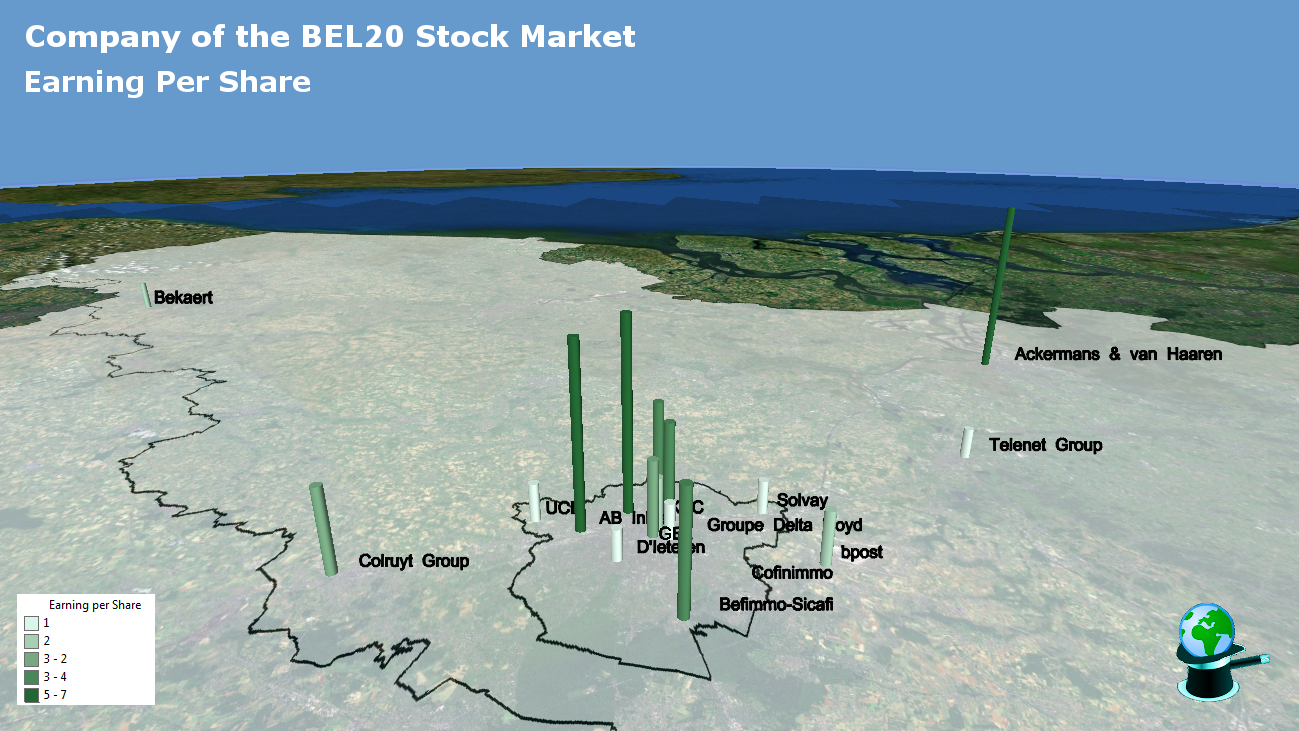
| Company | Ackermans & van Haaren | Groupe Delhaize | AB InBev | KBC | Befimmo-Sicafi | GDF Suez | Colruyt Group | Ageas | Umicore | bpost | Bekaert | UCB | Groupe Delta Lloyd | Solvay | Telenet Group |
|---|---|---|---|---|---|---|---|---|---|---|---|---|---|---|---|
| Earning per Share in EURO | 6.95 | 5.88 | 5.54 | 3.56 | 3.43 | 3.05 | 2.47 | 2.29 | 1.69 | 1.58 | 1.43 | 1.17 | 1.07 | 1.03 | 1.01 |
The Earning Per Share is an indicator for the value of earning per share. The smaller, the more interesting to buy (I am not a stock buying adviser and this is not a indication to buy!!).
In this optic, Ackermans, Delhaize and AB Inbev are not very interesting stocks while Cofinimmo, Elia and Belgacom are!
P/E Ratio
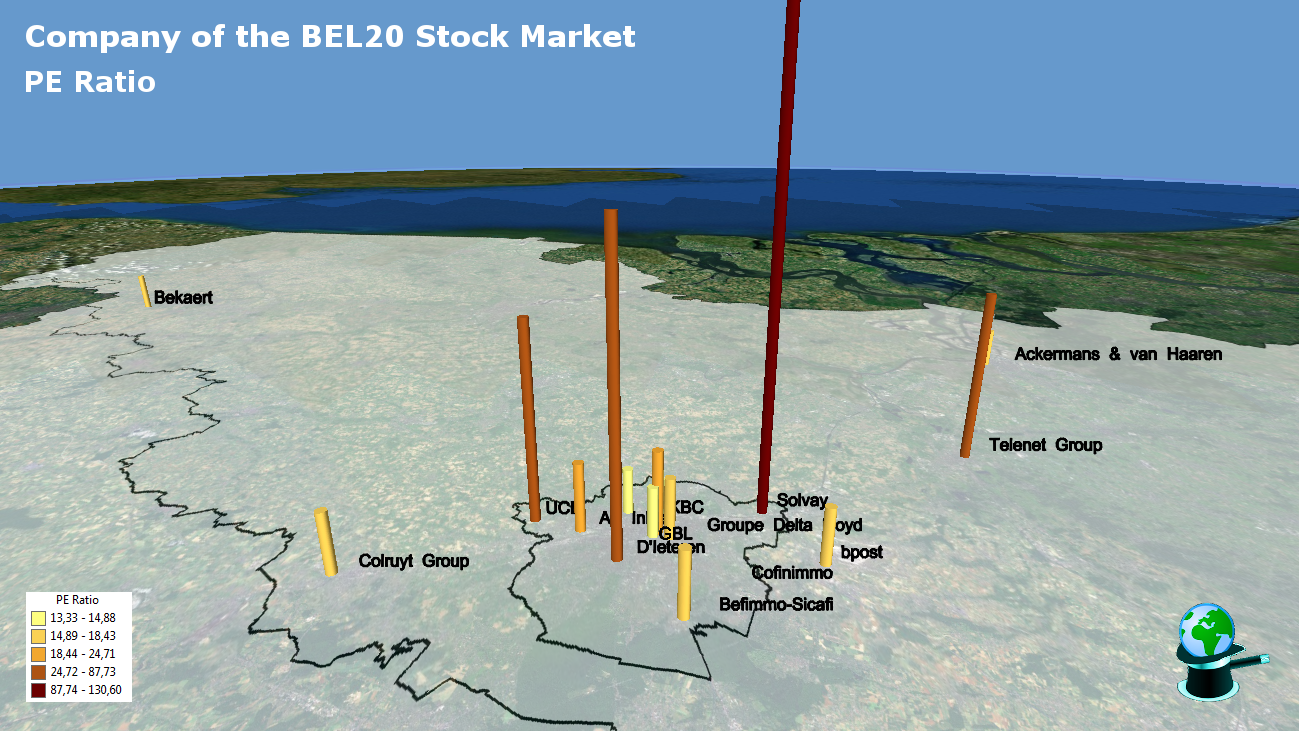
| Company | Solvay | D'Ieteren | UCB | Telenet Group | Umicore | AB InBev | Bekaert | Befimmo-Sicafi | Groupe Delta Lloyd | Colruyt Group | bpost | KBC | Ackermans & van Haaren | Ageas |
|---|---|---|---|---|---|---|---|---|---|---|---|---|---|---|
| PERatio | 130.60 | 87.73 | 58.74 | 54.95 | 24.71 | 20.51 | 18.43 | 18.34 | 17.96 | 17.74 | 16.58 | 16.44 | 15.80 | 14.88 |
The P/R is another indicator. The higher it is, the higher are the expectations of future growths in earnings (attention that it can also be the sign of a bubble when it is too high). Solvay, D’Ieteren and UCB are in this way very high.
Percent Change since year low (last 365 days)
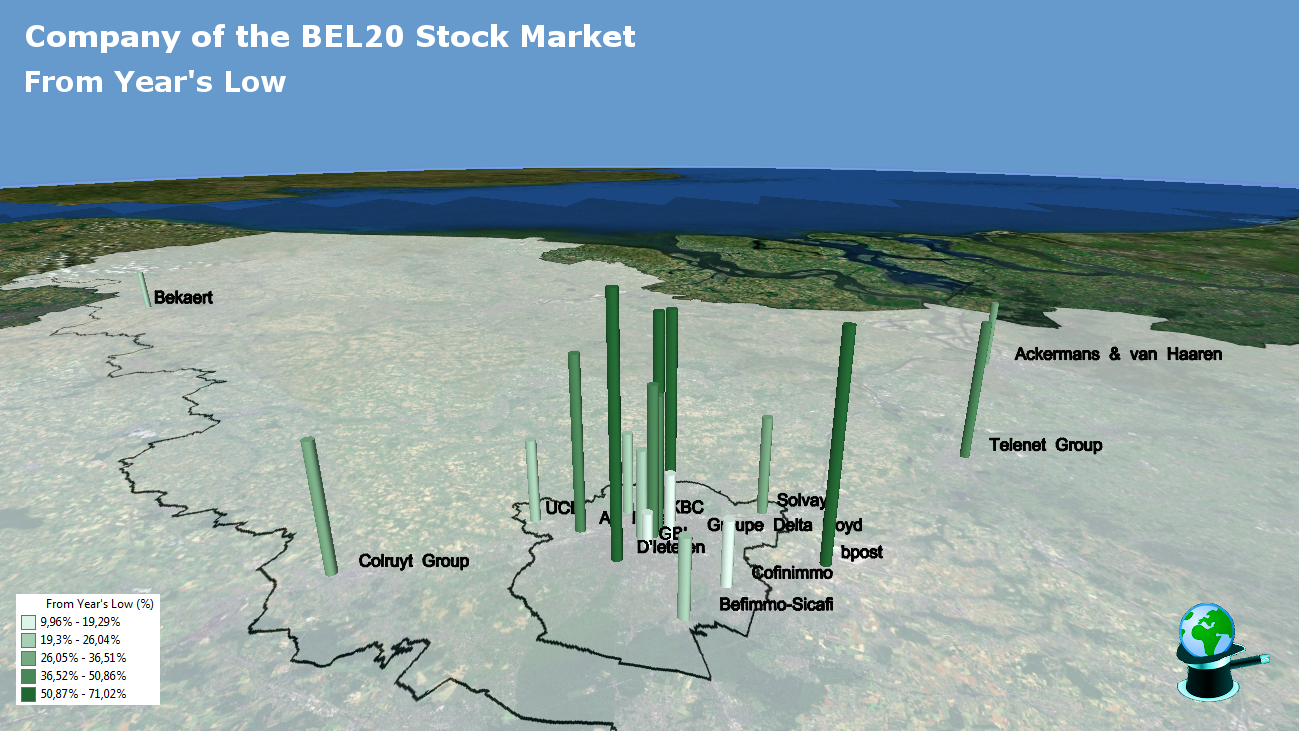
| Company | bpost | Belgacom | KBC | AB InBev | Telenet Group | Ageas | Umicore | Colruyt Group | Solvay | Ackermans & van Haaren | Elia | D'Ieteren | UCB | |
|---|---|---|---|---|---|---|---|---|---|---|---|---|---|---|
| Percent Change From Year Low | 62.93% | 61.57% | 60.25% | 50.86% | 45.96% | 43.58% | 40.08% | 36.51% | 29.41% | 28.42% | 26.04% | 26.01% | 24.72% |
From the map and the table, we see the stock that recovered the most from the last 365 days’ low is BPost with a recovery of 62,93% from the bottom. BPost is followed by Belgacom (+61,57%), and KBC (+60,25%).
Percent Change since year high (last 365 days)
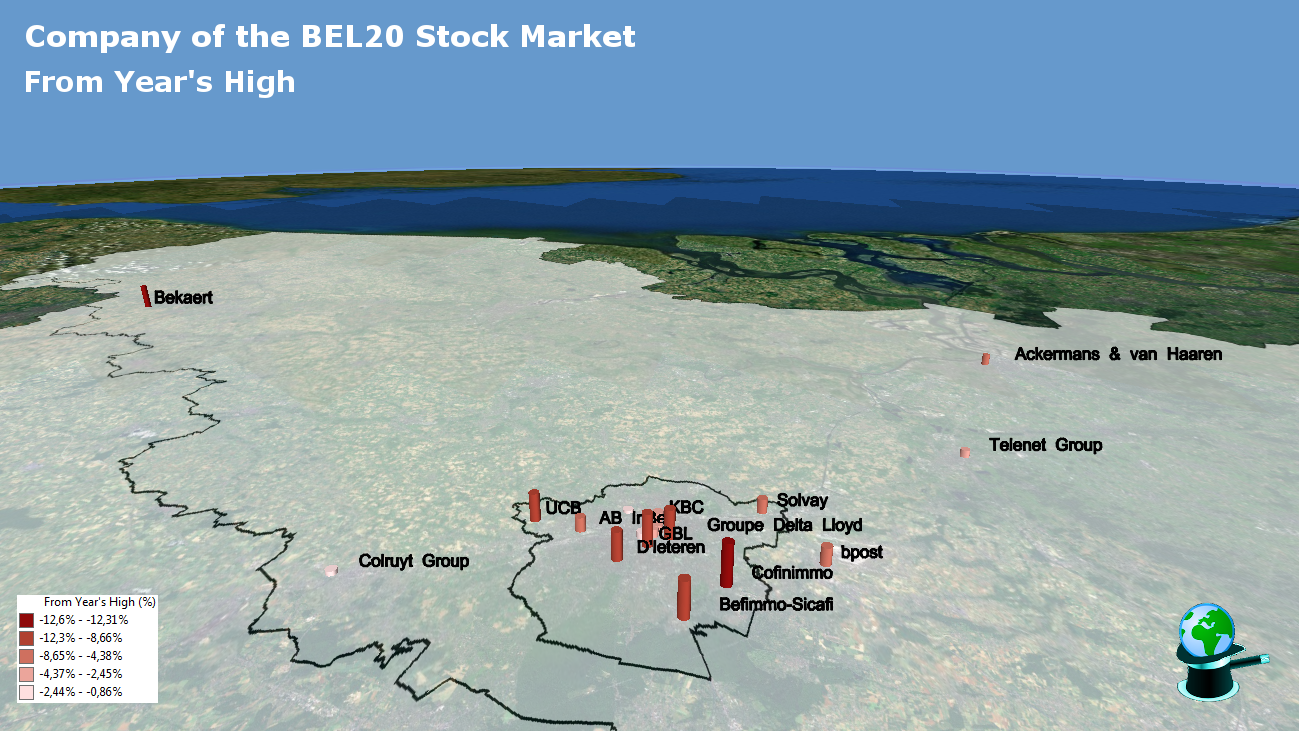
| Company | Bekaert | Cofinimmo | Befimmo-Sicafi | GBL | Groupe Delta Lloyd | UCB | D'Ieteren | bpost | Ackermans & van Haaren | Belgacom | Solvay | AB InBev | Umicore |
|---|---|---|---|---|---|---|---|---|---|---|---|---|---|
| Percent Change From Year High | -12.60% | -12.31% | -10.45% | -10.01% | -8.97% | -8.73% | -8.66% | -5.42% | -4.77% | -4.74% | -4.57% | -4.38% | -2.73% |
Here we have the percentage of loss since year’s high. This is also an interesting topic to see which stocks losses weight in a high bullish market. Bekaert lost about 12.60% from year’s high. It is followed by two real estate companies which are Cofinimmo and Befimmo with respectively -12.31% and 10.45%.