
Movebank.org is fabulous website that centralizes GPS data of tracked animals. Hosted by the Max Planck Institute for Ornithology, the platform data are accessible to researchers from all over the world to study animal movements ranging from cats and dogs to hooded vulture.
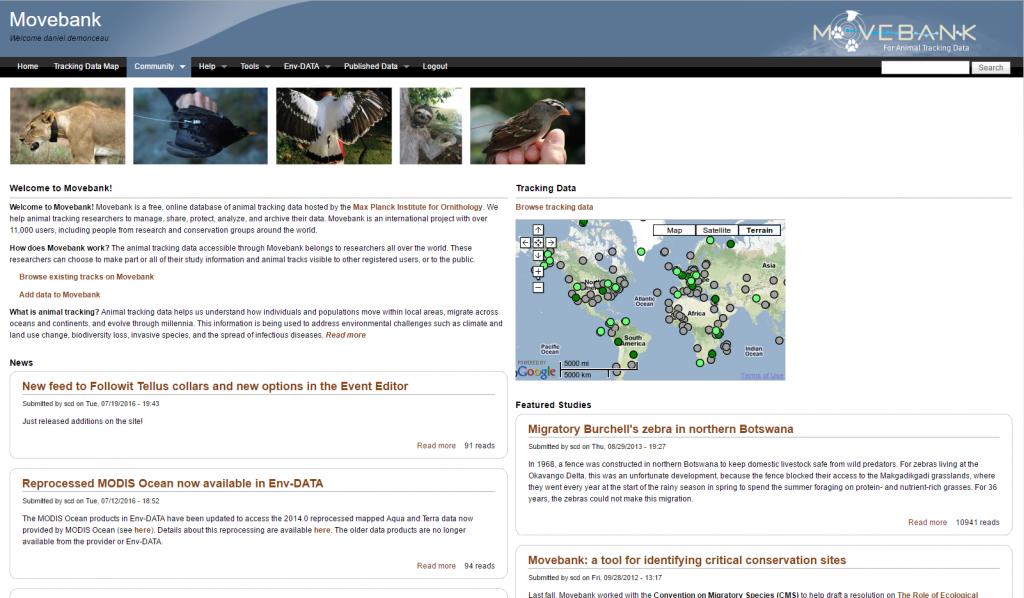
We decide to download data related to a Hooded Vulture in the Kruger National Park, South Africa, to illustrate how one could get most of this data. Simply go the Movebank Website on the map and search for Hooded Vulture in the Search Box. Then download the data in csv format.

Notice that no height or Z value information is available in the csv. What we’re now interested to extract the positions and the timestamps. Our objective is to learn a lot about the movements of the animals in terms of hunting ground, behavior, and seeing the animated movements in Google Earth. We’re at ease using a database to perform any query we want. So we’re using PostGIS.
Here are the steps for our studies.
- Create the PostGIS database
- Create the table and import the csv data
- Create the geometry field
- Create the Hooded Vulture paths (connect points by lines)
- Get Basic Statistics and create the map in QGIS
- Create the KML file
- Visualize the animation in Google Earth
Create the database
First connect to the database (open a command line window): psql -h<ip-address> -Upostgres
Create the database:
CREATE DATABASE animal_tracking WITH OWNER themagiscian;
Connect to the database with an admin as we want to enable the PostGIS cartridge.
psql -h<ip-address> -Upostgres -danimal_tracking
CREATE EXTENSION postgis;
You can now connect with your normal user. Note that the first line set the prompt window in UTF8 mode. We do the same for the psql interface once connected.
chcp 65001
psql -h192.168.1.87 -Uthemagiscian -danimal_tracking
SET client_encoding to 'UTF8'
Create the table and import the csv data
We’re now ready to import the data coming from the csv file.
First, create the table that will welcome the data. We got the column names from the csv file we opened in Excel. We quoted all the names because they are whether reserved keyword or they contain non-acceptable chars such as semicolon, colon, etc.
CREATE TABLE hooded_vulture_positions (
 "event-id" numeric(10),
 "visible" boolean,
 "timestamp" timestamp,
 "location-long" double precision,
 "location-lat" double precision,
 "external-temperature" double precision,
 "gps:satellite-count" numeric,
 "gps-time-to-fix" double precision,
 "ground-speed" double precision,
 "gt:activity-count" numeric,
 "gt:sys-week" numeric,
 "gt:tx-count" numeric,
 "heading" double precision,
 "height-above-ellipsoid" double precision,
 "height-raw" varchar(7),
 "location-error-text" varchar(50),
 "manually-marked-outlier" double precision,
 "tag-voltage" double precision,
 "vertical-error-numerical" double precision,
 "sensor-type" varchar(22),
 "individual-taxon-canonical-name" varchar(20),
 "tag-local-identifier" varchar(6),
 "individual-local-identifier" varchar(20),
 "study-name" varchar(21)

);
Load the table.
\copy hooded_vulture_positions FROM '/<path_to_the_file>/Hooded Vulture Africa.csv' HEADER DELIMITER ',' CSV;
Create the geometry field
The csv data file contains longitudes and latitudes. We need to create a specific geom field if we want to perform geographic processing in order to analyse the movement and if we want to see some results on a map in QGIS.
ALTER TABLE hooded_vulture_positions ADD COLUMN geom geometry;
UPDATE hooded_vulture_positions SET geom = ST_SetSRID(ST_MakePoint("location-long", "location-lat"), 4326);
SELECT UpdateGeometrySRID('hooded_vulture_positions','geom',4326);
CREATE INDEX hooded_vulture_positions_gix ON hooded_vulture_positions USING GIST (geom);
VACUUM ANALYZE hooded_vulture_positions;
Create the Hooded Vulture paths (connect points by lines)
The next step is to connect the consecutive points with each other.
Create first the table.
DROP TABLE hooded_vulture_lines;
CREATE TABLE hooded_vulture_lines AS SELECT "event-id" AS "from-event-id", "event-id" AS "to-event-id",
"timestamp" AS "from-timestamp", "timestamp" AS "to-timestamp", geom FROM hooded_vulture_positions WITH NO DATA;
The function used to connect points is ST_MakeLine. The thing is that we first classify the points based on the timestamp and then we connect each consecutive point. The best way to performit is to loop through the table. We do that using the following PL/SQL script. Notice how we focus on the tag-local-identifier 139251. In fact, the csv file we downloaded contains several individuals and we want to focus only on one.
CREATE OR REPLACE FUNCTION create_lines() RETURNS void AS
$BODY$
DECLARE
 r hooded_vulture_positions%rowtype;
 old_eventidfrom numeric;
 old_timestamp timestamp;
 old_geom geometry;
BEGIN
 FOR r IN SELECT * FROM hooded_vulture_positions WHERE "tag-local-identifier" = '139251' ORDER BY "timestamp" ASC
 LOOP
 INSERT INTO hooded_vulture_lines VALUES (old_eventidfrom, r."event-id", old_timestamp, r."timestamp", ST_MakeLine(old_geom, r.geom));
 old_eventidfrom := r."event-id";
 old_timestamp := r."timestamp";
 old_geom := r.geom;
 END LOOP;
END
$BODY$
LANGUAGE 'plpgsql' ;
Execute the function.
SELECT create_lines();
A clean job involves setting the correct SRS and indexing the data.
SELECT UpdateGeometrySRID('hooded_vulture_lines','geom',4326);
CREATE INDEX hooded_vulture_lines_gix ON hooded_vulture_lines USING GIST (geom);
For information, we create a new field with the length of each segment.
ALTER TABLE hooded_vulture_lines ADD COLUMN distance double precision;
UPDATE hooded_vulture_lines SET distance = ST_Length(geom::geography)/1000;
Get Basic Statistics
All the previous jobs were done to make it possible to perform statistics on the data and to make the map using QGIS.
How many positions do we have?
SELECT count(*) from hooded_vulture_positions WHERE "tag-local-identifier" = '139251';
 count
-------
 9680
In which time interval?
SELECT min("timestamp") as "start", max("timestamp") as "finish" FROM hooded_vulture_positions WHERE "tag-local-identifier" = '139251';
 start | finish
---------------------+---------------------
 2014-12-14 03:00:00 | 2016-08-02 03:00:00
What is the total distance covered during the study time and based on the GPS data?
SELECT sum(ST_Length(geom::geography))/1000 || ' km' as TOTAL_LENGTH FROM hooded_vulture_lines;
 total_length
---------------------
 26264.8193016478 km
What about the busiest days? (lengths are in km)
SELECT EXTRACT(YEAR FROM "from-timestamp") || '/' || LPAD(EXTRACT(MONTH FROM "from-timestamp")::text, 2, '0') || '/' || LPAD(EXTRACT(DAY FROM "from-timestamp")::text, 2, '0') "Date",
 sum(ST_Length(geom::geography))/1000::double precision as total_length FROM hooded_vulture_lines GROUP BY EXTRACT(YEAR FROM "from-timestamp"), EXTRACT(MONTH FROM "from-timestamp"), EXTRACT(DAY FROM "
from-timestamp") ORDER BY total_length desc LIMIT 10;
 Date | total_length
------------+------------------
 |
 2015/06/05 | 177.357438408111
 2015/02/26 | 174.974560854037
 2015/02/18 | 173.766023783359
 2015/03/10 | 162.334720926385
 2015/05/21 | 161.941723565214
 2015/05/03 | 155.456692232334
 2015/10/07 | 150.336621420365
 2015/03/13 | 146.837049519552
 2015/05/10 | 145.162814856346
These results are not surprising as Hooded Vultures can travel as far as 150km a day to find food.
And finallly, we want to know the extreme points: Nothernmost, Southernmost, Easternmost and Westernmost point as well as the centroid of the point cloud. We store these results in a separate table.
-- Northern most point
DROP TABLE hooded_vulture_spatial_statistics;
CREATE TABLE hooded_vulture_spatial_statistics AS SELECT "event-id" as eventid, 'Northernmost point'::varchar(30) as description, "timestamp", ST_Y(geom)::varchar(10) as coordinate, geom FROM hooded_vulture_positions WHERE "tag-local-identifier" = '139251' AND ST_Y(geom) = (SELECT max(ST_Y(geom)) FROM hooded_vulture_positions WHERE "tag-local-identifier" = '139251') LIMIT 1;

-- Sourthernmost point
INSERT INTO hooded_vulture_spatial_statistics SELECT "event-id" as eventid, 'Sourthernmost point'::varchar(30) as description, "timestamp", ST_Y(geom)::varchar(10) as coordinate, geom FROM hooded_vulture_positions WHERE "tag-local-identifier" = '139251' AND ST_Y(geom) = (SELECT min(ST_Y(geom)) FROM hooded_vulture_positions WHERE "tag-local-identifier" = '139251') LIMIT 1;

-- Easternmost point
INSERT INTO hooded_vulture_spatial_statistics SELECT "event-id" as eventid, 'Easternmost point'::varchar(30) as description, "timestamp", ST_X(geom)::varchar(10) as coordinate, geom FROM hooded_vulture_positions WHERE "tag-local-identifier" = '139251' AND ST_X(geom) = (SELECT max(ST_X(geom)) FROM hooded_vulture_positions WHERE "tag-local-identifier" = '139251') LIMIT 1;

-- Westernmost point
INSERT INTO hooded_vulture_spatial_statistics SELECT "event-id" as eventid, 'Westernmost point'::varchar(30) as description, "timestamp", ST_X(geom)::varchar(10) as coordinate, geom FROM hooded_vulture_positions WHERE "tag-local-identifier" = '139251' AND ST_X(geom) = (SELECT min(ST_X(geom)) FROM hooded_vulture_positions WHERE "tag-local-identifier" = '139251') LIMIT 1;

-- Center of gravity of the positions
INSERT INTO hooded_vulture_spatial_statistics SELECT '9999' as eventid, 'Centroid' as description, '2016-08-04 00:00:00.00', '', ST_Centroid(ST_Multi(ST_UNION(geom))) geom FROM hooded_vulture_positions WHERE "tag-local-identifier" = '139251';

SELECT UpdateGeometrySRID('hooded_vulture_spatial_statistics','geom',4326);
CREATE INDEX hooded_vulture_spatial_statistics_gix ON hooded_vulture_spatial_statistics USING GIST (geom);
What we can do with all these analysis is to put them on the map (using QGIS).
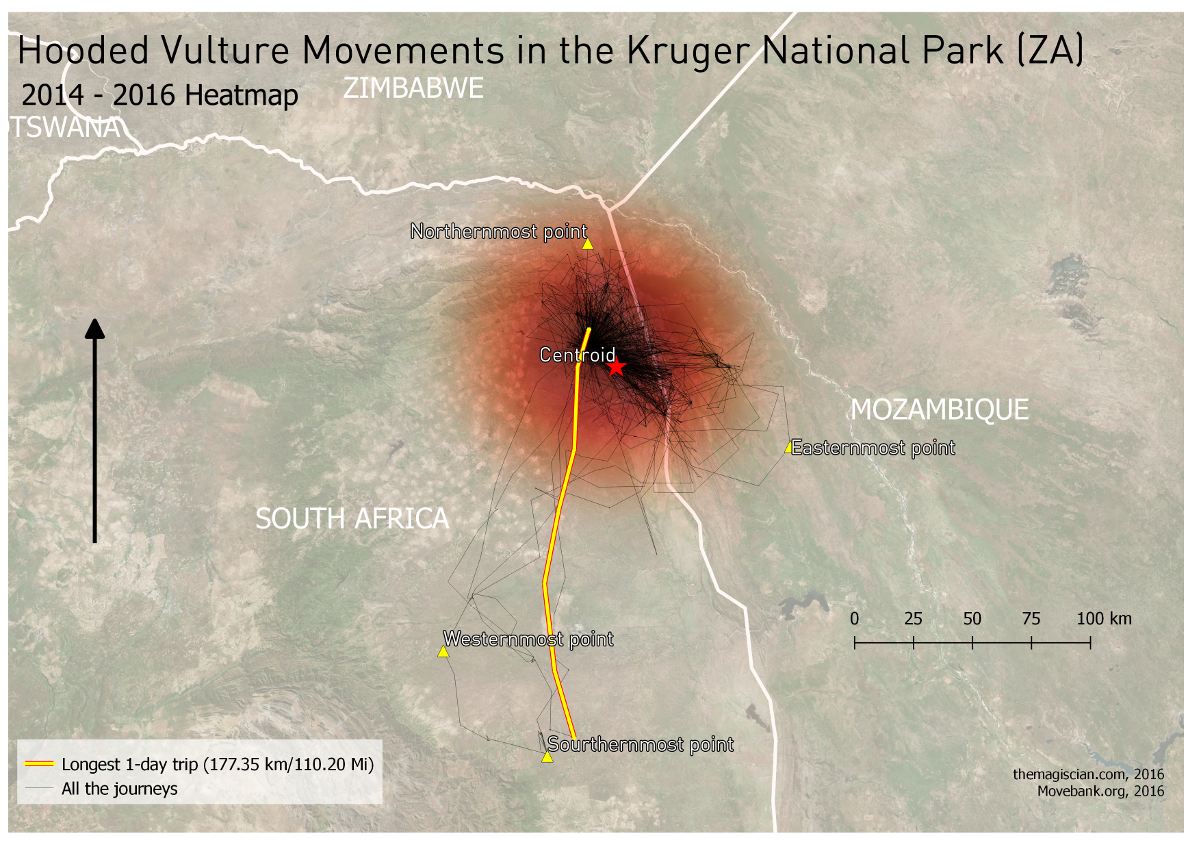
The hooded vulture we’re tracking stays more or less in the same area all the time (end 2014 to mid-2016). The crowdest area is roughly an area of 40km in length and 25km in width with direction NW-SE, except for some longer journeys to the extreme points.
Create the KML file
Up to now we were focused on statistics and situational facts. What about creating an animation in Google Earth and study the behavior of the hooded vulture?
There are several ways of getting a KML file from Movebank.org. The first being to download directly the data in KML format (instead of the CSV as we did). The ogr2ogr utility can extract PostGIS data and convert them into a KML file. But the problem with these solutions is that they do not include the <TimeStamp><when> tags which are necessary to see animations in GE. Working with these files to get them in shape is not an easy matter so we kept the simplest solution: creating our tags directly from an SQL query. It looks like this.
SELECT '<Placemark><TimeStamp><when>' || EXTRACT(YEAR FROM "timestamp") || '-' || LPAD(EXTRACT(MONTH FROM "timestamp")::text, 2, '0')
|| '-' || LPAD(EXTRACT(DAY FROM "timestamp")::text, 2, '0') || 'T' || LPAD(EXTRACT(HOUR FROM "timestamp")::text, 2, '0') || ':' ||
LPAD(EXTRACT(MINUTE FROM "timestamp")::text, 2, '0') || ':' || LPAD(EXTRACT(SECOND FROM "timestamp")::text, 2, '0') || 'Z' ||
'</when></TimeStamp><styleUrl>#hooded_vulture-icon</styleUrl><Point><gx:altitudeMode>relativeToGround</gx:altitudeMode><coordinates>'
|| ST_X(geom) || ',' || ST_Y(geom) || ',30</coordinates></Point></Placemark>' FROM hooded_vulture_positions
WHERE "tag-local-identifier" = '139251' ORDER BY "timestamp" \g hooded_vulture_za_path.kml
We include in the response the needed tags and we format the date and time in a by GE readable format. Notice how we add the Z coordinate to 30 in order to have an altitude value. To not forget are to add the leading zeros in the month and day number (using the LPAD). the \g indicates we’re storing the result in the hooded_vulture_za_path.kml file.
Our KML is not ready to be processed by Google Earth yet. We need to add the headers and the footers.
Paste this into the file at the beginning.
<?xml version="1.0" encoding="UTF-8"?>
<kml xmlns="http://earth.google.com/kml/2.2" xmlns:gx="http://www.google.com/kml/ext/2.2">
 <Document>
 <name>Hooded Vulture Life</name>
 <Style id="hooded_vulture-icon">
 <IconStyle>
 <Icon>
 <href>hooded_vulture_icon.png</href>
 </Icon>
 <hotSpot x="0" y=".5" xunits="fraction" yunits="fraction"/>
 </IconStyle>
 </Style>
 <Style id="check-hide-children">
 <ListStyle>
 <listItemType>checkHideChildren</listItemType>
 </ListStyle>
 </Style>
 <styleUrl>#check-hide-children</styleUrl>
Notice we use a custom symbology: a hooded vulture clipart name hooded_vulture-icon with the path specified in the href. Also use the checkHideChildren value for avoiding having all the 9680 elements listed in he legend of GE.
Paste the footer part in the file and save.
 </Document>
</kml>
Visualize the animation in Google Earth
If the KML is well formed, Google Earth should directly open the animation pane.
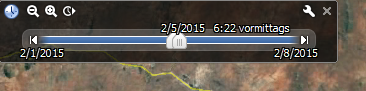
Adjust the options (reading speed, time interval, etc.) and enjoy the animation!
This video was created with the Movie Maker feature in Google Earth.
Analyses. What we can see is that the bird is flying almost every day over the valley of the Shingwedzi River. Most of his food can be found in this area assumably. Also interesting, the vulture stays one day West of the study area, and one day East as it would alternate his sleeping place. The distance between these points is approximately 50 km.
Conclusion
This article shows us how to exploit data coming for the valuable Movebank.org website. People are sharing GPS data about their animal friends and getting the most out of the data teaches us a lot. A tremendous amount of statistics can be done and making a Google Earth animation shows us its movement behavior.
All of this is possible using ETL techniques and handling tools such as PostGIS, QGIS and Google Earth.
Cheers,
Daniel
One thought on “A Hooded Vulture Wildlife study using Movebank, PostGIS, QGIS and KML”