
The trend in IT is currently dominated by terms like “Big Data”, “Real-Time”, “Fast Data”, “Smart Data”, … GIS is no exception as most of the data out there can be geolocalized. As the amount of available data is growing and becoming huge, there are more and more agencies (often public) who put their data for free on Open Data Portals to crowdsource data analyses. They, in turn, become bread and butter for GIS enthusiasts for their applications.
Living in Sydney since January (I live in Melbourne now), I came across the wonderful Public Transport Open Data Portal of NSW.

Besides all the static data, there is a web API streaming the real-time position of the vehicles of the NSW Transport Company like the trains, busses, ferries, and light rails. This particular API got my attention and I was curious to exploit this API to display the ferries on a map using exclusively Open Source GIS technologies. The end product of my development looks like this (one position every 10 seconds in accelerated mode):
To reproduce at home here’s the plan
- Prepare the database model for storing the incoming data (PostGIS)
- Develop a script that gathers the latest positions available and updates the database (Python)
- Expose the data via an Application Server (GeoServer)
- Consume the WMS services and display the data on a map (OpenLayers)
NB: All the codes can be found on my github page.
Set up the database (PostGIS)
We need at least two tables: One that welcomes the latest positions for every ferry, and another for archiving these positions.
The first step is to create the database with a superuser, to connect to it with the current user, and to create the extension.
-- Database creation
DROP DATABASE sydney_transport;
CREATE DATABASE sydney_transport WITH OWNER themagiscian;
-- Connect to the database with the correct user as we're creating the postgis extension
\c sydney_transport postgres
-- If needed, create the postgis extension
CREATE EXTENSION postgis;
Let’s create our ferries table based on the structure of the data coming from the API. We will see it more in detail later but the raw data coming from the API looks like this:
id: "3366bd10-e7be-4bee-9934-5719b8cccfd0"
vehicle {
 trip {
 trip_id: "NB164-3196"
 }
 position {
 latitude: -33.8606529236
 longitude: 151.211135864
 bearing: 177.399993896
 speed: 0.300000011921
 }
 timestamp: 1495538649
 vehicle {
 id: "1011"
 label: "Scarborough"
 }
}
Create the table with the same structure.
DROP TABLE ferries;
CREATE TABLE ferries (
 id serial NOT NULL PRIMARY KEY,
 entity_id varchar(36) NOT NULL ,
 trip_id varchar(10),
 vehicle_id varchar(4) NOT NULL ,
 label varchar(20) NOT NULL ,
 time_text varchar(24),
 time_posix integer,
 latitude double precision,
 longitude double precision,
 bearing double precision,
 speed double precision,
 geom geometry(Point, 4326)
);
Note the field time_posix: we will have to convert it to a human readable format (that’s why we create the time_text field as well). Let’s create another table with the same structure but for storing the historical values.
DROP TABLE ferries_hist;
CREATE TABLE ferries_hist (
 id serial NOT NULL PRIMARY KEY,
 entity_id varchar(36) NOT NULL ,
 trip_id varchar(10),
 vehicle_id varchar(4) NOT NULL ,
 label varchar(20) NOT NULL ,
 time_text varchar(24),
 time_posix integer,
 latitude double precision,
 longitude double precision,
 bearing double precision,
 speed double precision,
 geom geometry(Point, 4326)
);
The structure of our data model and the rules are as follows:
- Data coming from the API are inserted into the ferries table
- A trigger is fired for each bulk insert to duplicate the data into the ferries_hist table
- Both tables have a trigger that fires the geometry creation based on the longitude and latitude provided from the raw data
- The trigger on the ferries table also deletes entries so that there is only one entry per ferry with the latest position
- After every insert into the ferries and ferries_hist tables, there’s a trigger that checks and deletes for redundant entries
- As the ferries table changes quite often – every 10 seconds as we will see later – we create on top of it a VIEW
- Last but not least, we regularly update (after 50 inserts) the spatial index
The Trigger that is fired when INSERT operations are made on the ferries table updates the ferries_hist table
06.CREATE_TRIGGER_TO_HIST.sql

DROP TRIGGER sendtohist_trigger ON ferries;
DROP FUNCTION sendtohist();
CREATE OR REPLACE FUNCTION sendtohist()
RETURNS trigger
LANGUAGE plpgsql
SECURITY DEFINER
AS $BODY$
DECLARE
vid text;
BEGIN
INSERT INTO ferries_hist (entity_id, trip_id, vehicle_id, label,
time_text, time_posix, latitude, longitude, bearing, speed)
VALUES (NEW.entity_id, NEW.trip_id, NEW.vehicle_id, NEW.label,
NEW.time_text, NEW.time_posix, NEW.latitude, NEW.longitude,
NEW.bearing, NEW.speed);

RETURN NEW;
END
$BODY$;

CREATE TRIGGER sendtohist_trigger
AFTER INSERT
ON ferries
FOR EACH ROW
EXECUTE PROCEDURE sendtohist();
After each INSERT, the geometry is calculated with the provided longitude and latitude.
07.CREATE_TRIGGER_SETGEOM.sql

DROP TRIGGER setgeom_trigger ON ferries_hist;
DROP TRIGGER setgeom_trigger ON ferries;
DROP FUNCTION setgeom();
CREATE OR REPLACE FUNCTION setgeom()
RETURNS trigger
LANGUAGE plpgsql
SECURITY DEFINER
AS $BODY$
BEGIN
  EXECUTE 'UPDATE ' || TG_TABLE_NAME || ' SET geom =
  ST_SetSRID(ST_Point(longitude, latitude), 4326) WHERE geom IS NULL';
RETURN NEW;
END
$BODY$;

CREATE TRIGGER setgeom_trigger
AFTER INSERT
ON ferries_hist
FOR EACH ROW
EXECUTE PROCEDURE setgeom();

CREATE TRIGGER setgeom_trigger
AFTER INSERT
ON ferries
FOR EACH ROW
EXECUTE PROCEDURE setgeom();
The trigger that deletes the duplicates in each table.
08.CREATE_TRIGGER_DELETE_DUPLICATES.sql

DROP FUNCTION deleteduplicate();
CREATE OR REPLACE FUNCTION deleteduplicate()
RETURNS void
LANGUAGE plpgsql
AS $BODY$
DECLARE
 vid text;
BEGIN

FOR vid IN SELECT DISTINCT vehicle_id FROM ferries
 LOOP
 RAISE NOTICE 'DELETE FROM ferries WHERE vehicle_id = %
AND time_posix NOT IN (SELECT MAX(time_posix) FROM ferries
WHERE vehicle_id = %)', vid, vid;
 EXECUTE 'DELETE FROM ferries WHERE vehicle_id = '''
 || vid || ''' AND time_posix NOT IN (SELECT MAX(time_posix)
 FROM ferries WHERE vehicle_id = ''' || vid || ''')';
 END LOOP;

DELETE FROM ferries
 WHERE id NOT IN (
 SELECT MAX(f.id)
 FROM ferries As f
 GROUP BY f.vehicle_id, f.time_posix
 );

DELETE FROM ferries_hist
 WHERE id NOT IN (
 SELECT MAX(f.id)
 FROM ferries_hist As f
 GROUP BY f.vehicle_id, f.time_posix
 );
END
$BODY$;
A function that recreates the spatial index.
09.CREATE_GIST_INDEX.sql
DROP FUNCTION createGistIndex(VARCHAR);
CREATE OR REPLACE FUNCTION createGistIndex(table2Index VARCHAR)
RETURNS void
LANGUAGE plpgsql
AS $BODY$
DECLARE
 t2i varchar := replace(table2Index, '"', '');
BEGIN
 EXECUTE 'DROP INDEX IF EXISTS ' || t2i || '_gix;';
 EXECUTE 'CREATE INDEX ' || t2i || '_gix ON ' || t2i || ' USING GIST (geom);';
END
$BODY$;
That’s it for the database part!
Get the real-time positions and insert them into a database (Python)
This is the core of our application: get the real-time data and insert them into our database. The data format distributed through the api is the GTFS-realtime format. This format stands for “General Transit Feed Specification” and is an open data format for public transportation-related information. This format is based on Protocol buffers which are a “language-neutral, platform-neutral extensible mechanism for serializing structured data” according to Google.
The link to access the web API is the following https://opendata.transport.nsw.gov.au/dataset/public-transport-realtime-vehicle-positions. Note that you have to create an account to have access to the data.
There are tons of technologies out there for handling GTFS-realtime data. We opt for the versatile Python language for its simplicity of implementation.
Let’s start with the imports.
from google.transit import gtfs_realtime_pb2
from psycopg2 import sql
import urllib2
import time
import psycopg2
import threading
We need the google.transit package in order to be able to read the encrypted real-time data coming from the API. psycopg2 is for the connection to the database, urllib2 is for sending our request to the API.
We then defined our global database variables to open a connection to the database. After that, we define a feed object that will unwrap the encrypted response coming from the API. Finally, we set the HTTP Get parameters to be sent to the API.
try:
 connection = psycopg2.connect(host=hostname, user=username, password=password, dbname=database)
 feed = gtfs_realtime_pb2.FeedMessage()
 req = urllib2.Request('https://api.transport.nsw.gov.au/v1/gtfs/vehiclepos/' + transport)
 req.add_header('Accept', 'application/x-google-protobuf')
 req.add_header('Authorization', 'apikey ***')
except e:
 print e
Note that we use the “transport” variable which takes here the String value “ferries”. This one can be changed to “trains”, “buses”, or “light rail.” Not to forget to create a function that will actually execute our database queries once the information from the API is gathered.
def doQuery(conn, query, data):
 cur = conn.cursor()
 cur.execute(query, data)
Now comes the core of our script:
- Gather the response from the API,
- putting the results in a template INSERT INTO database request,
- and executing these request to the database
All these operations are executed every, let’s say, 10 seconds – and thus the use of the thread in the script that follows.
The function to be executed every 10 seconds is obviously called getPositions()
def getPositions():
 global COUNT
 threading.Timer(10.0, getPositions).start()
 response = urllib2.urlopen(req)
 feed.ParseFromString(response.read())
 doQuery(connection, """BEGIN""", None)
The parameter “response” contains the whole response from the API. The first “commit” operation start the whole database transaction. Transaction is very important here: For each query to the API, there is a big bunch of data retrieved and they need to be processed and inserted into the database. The “ParseFromString” operation cuts the response into smaller pieces and each piece is put into an array we exploit later in a for loop.
for entity in feed.entity:
 query = "INSERT INTO {} (entity_id, trip_id, vehicle_id, label, time_text, time_posix, latitude, longitude, bearing,
speed) VALUES (%s, %s, %s, %s, %s, %s, %s, %s, %s, %s);"
 data = (str(entity.id), str(entity.vehicle.trip.trip_id), str(entity.vehicle.vehicle.id),
  str(entity.vehicle.vehicle.label), str(time.ctime(int(entity.vehicle.timestamp))), str(entity.vehicle.timestamp),
  str(entity.vehicle.position.latitude), str(entity.vehicle.position.longitude), str(entity.vehicle.position.bearing),
  str(entity.vehicle.position.speed))
 doQuery(connection, sql.SQL(query).format(sql.Identifier(transport)), data)
 doQuery(connection, "SELECT deleteduplicate();", None)
 doQuery(connection, sql.SQL("SELECT createGistIndex('{}');").format(sql.Identifier(transport)), None)
The separation between the query template and the data to be inserted in, as preconized by psycopg2, is respected here. The whole is then sent to the doQuery function we discussed earlier.
The whole script is then run and as said, it gather new data every 10 seconds and feeds the database.
Here’s a sample of the results we got.
 id     | trip_id    | label          | time_text                | latitude| longitude|bearing | speed
--------+------------+----------------+--------------------------+---------+---------+---------+-------
1874191 | ES170-2960 | Mary MacKillop | Wed May 03 22:15:08 2017 | -33.855 | 151.188 | 330.800 | 0.100
1874195 | ML172-2846 | Freshwater     | Wed May 03 22:15:08 2017 | -33.860 | 151.211 | 104.5   | 0
1874197 | MS160-3114 | Golden Grove   | Wed May 03 22:15:09 2017 | -33.842 | 151.232 | 334.800 | 5.400
1874203 | NB162-3116 | Friendship     | Wed May 03 22:15:09 2017 | -33.860 | 151.211 | 35.800  | 0.100
1874205 | NB164-3116 | Fishburn       | Wed May 03 22:15:09 2017 | -33.851 | 151.211 | 293.200 | 11.500
1874206 | RV230-3080 | Betty Cuthbert | Wed May 03 22:15:09 2017 | -33.854 | 151.187 | 148.300 | 0
1874208 | RV236-3080 | Marjorie Jackson|Wed May 03 22:15:09 2017 | -33.842 | 151.180 | 132.100 | 5.400
 864505 | ES644-2832 | Susie O'Neill  | Sun Apr 30 16:49:09 2017 | -33.855 | 151.188 | 68.600  | 0
 884575 | TZ650-3078 | Lady Herron    | Sun Apr 30 17:33:13 2017 | -33.860 | 151.210 | 190.500 | 2.600
1856440 | DH156-2800 | Louise Sauvage | Wed May 03 20:28:07 2017 | -33.850 | 151.214 | 331.600 | 6.010
Expose the data via an Application Server (GeoServer)
In our n-tier architecture, our cartographic server is GeoServer, which is a reliable Open Source product for our purpose.
We just create a layer on top of the view we defined during the database part.
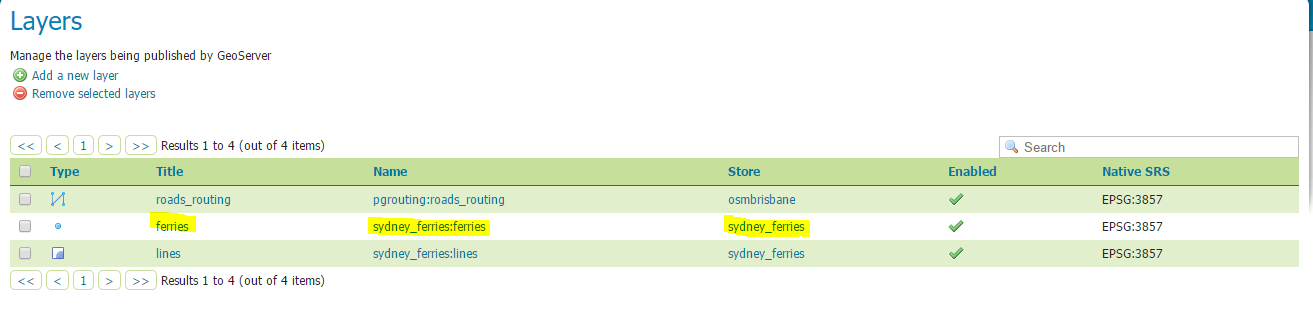
Consume the WMS service and display the data on a map (OpenLayers)
Beside all the conventional files (index.html, style.css, etc.) the most interesting file is add_sflayer.js. We reference the layer and add it to the map.
var params_ferries = {'LAYERS': 'sydney_ferries:ferries'}
var wmsSource_ferries = new ol.source.TileWMS({
 url: 'http://jupiter:8080/geoserver/sydney_ferries/wms',
 params: params_ferries
})

var wmsLayer_ferries = new ol.layer.Tile({
 source: wmsSource_ferries
});
For having a dynamic map, or in other words to see the ferries moving on the map, we need to refresh the view at specified intervals. We use the same 10 seconds as we defined for the Python script.
var refreshLayer = function(){
 wmsSource_ferries.updateParams({"time": Date.now()});
 updateTimer = setTimeout(function() {
 refreshLayer();
 }, 10000);
}

refreshLayer();
It reads again the WMS source, whose data are coming from the ferries_view. Just to remind, this view is on top of the ferries table, which is refreshed every 10 seconds.
Bonus
After a while, there are sufficient data into the database to create traces for the ferries. Just link all the points of the same ferries together to get the path as highlighted in blue in the previous screenshot.
CREATE TABLE lines AS
SELECT fh.vehicle_id, fh.label, ST_LineToCurve(ST_MakeLine(fh.geom ORDER BY time_posix)) geom
 FROM ferries_hist fh GROUP BY fh.vehicle_id, fh.label;
CREATE INDEX lines_gix ON lines USING GIST (geom);
VACUUM ANALYZE lines;
Statistics
The script ran the whole day on Wednesday the 3rd of May from 06:49:07 to 22:15:09. During that period, 129 446 positions have been gathered for the 20 ferries composing the fleet., and which are Alexander, Betty Cuthbert, Charlotte, Dawn Fraser, Fishburn, Freshwater, Friendship, Golden Grove, Lady Herron, Lady Northcott, Louise Sauvage, Marjorie Jackson, Mary MacKillop, Nicole Livingstone, Pam Burridge, Scarborough, Sirius, SuperCat 4, Supply, and Susie O’Neill.
The 3 ferries that travelled the longest distances during that day are the following ones:
select vehicle_id, label, st_length(geom::geography)/1000 "distance (km)" from lines_0305 order by length desc;
 vehicle_id | label            | distance (km)
------------+------------------+------------------
 1020       | Marjorie Jackson | 242.693213184936
 1002       | Freshwater       | 209.724200233982
 1027       | SuperCat 4       | 200.775006102889
The first one is the Parramatta line, the second is the Manly line, and the third covers the Eastern Suburbs.
Cheers,
Daniel
This is innovative.Considering it is all achieved on opensource platforms.
I am looking to simulate a similar thing with buses in my city to accurately predict travel ETAs.