
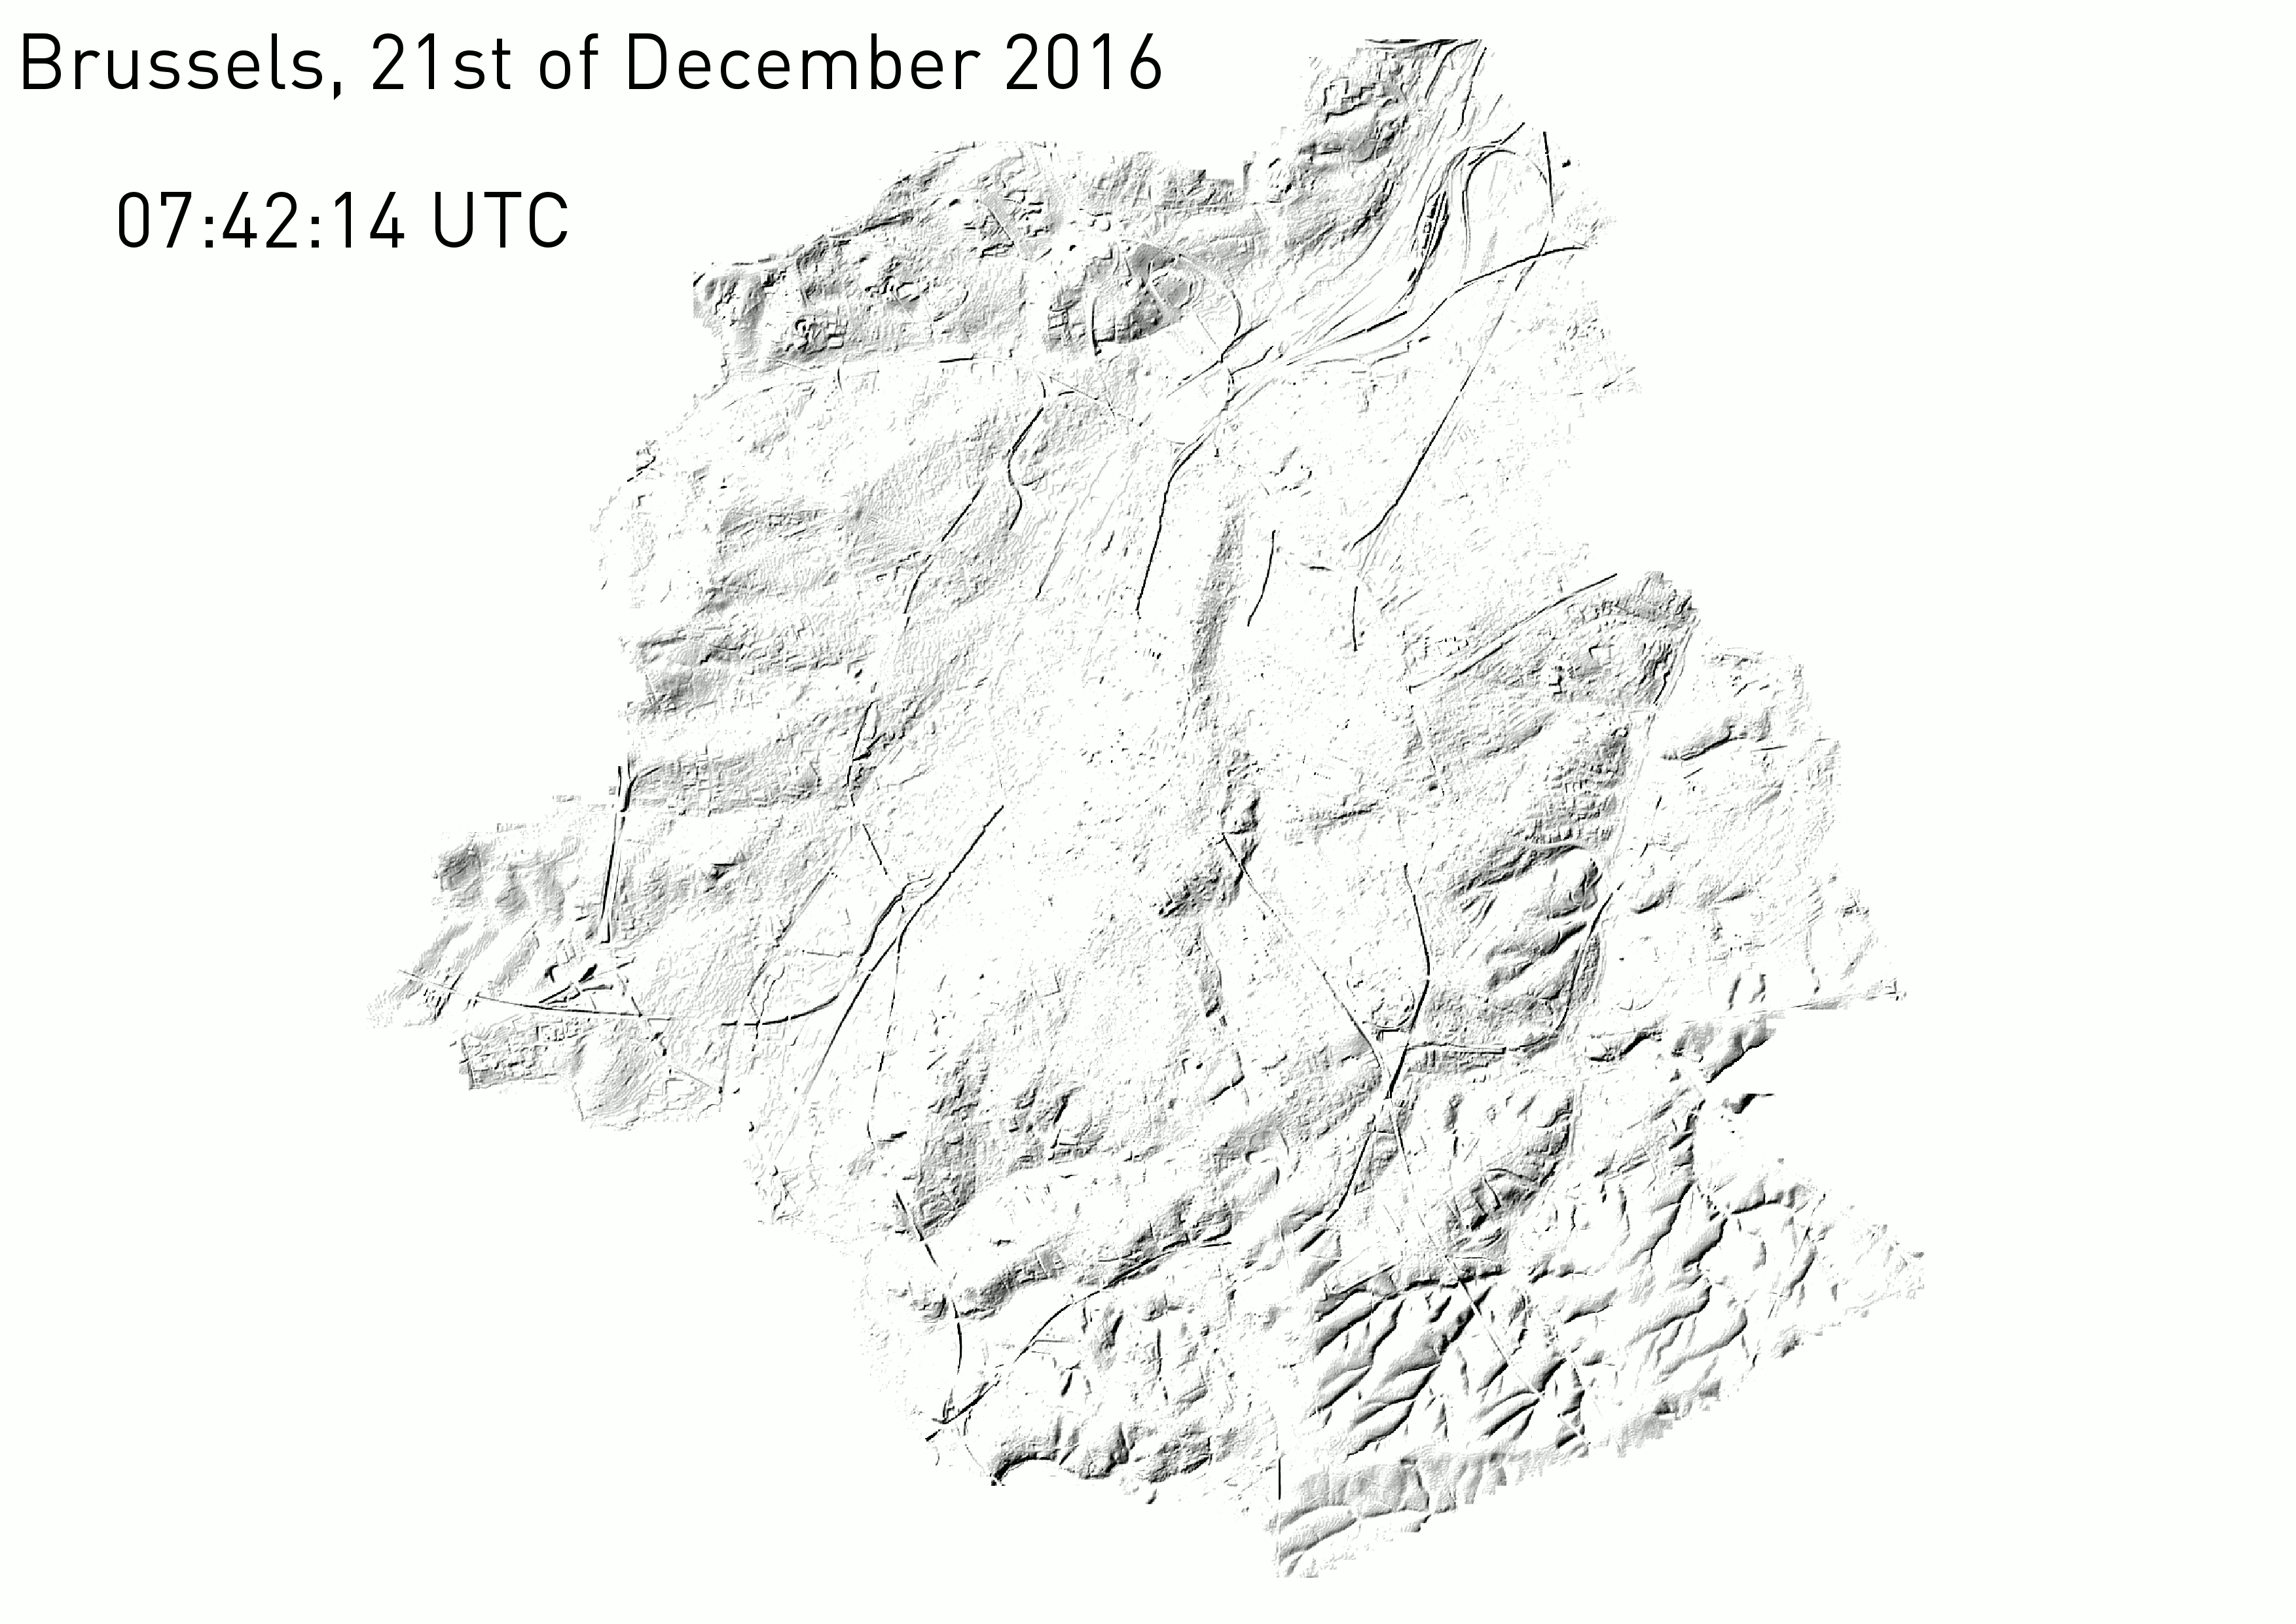
Yesterday, the 21st of December 2016, was the shortest day in the Northern Hemisphere. In other words, it is the day the sun is the lowest in the sky at noon of all the year. This winter solstice gave me the idea to create a series of hillshade of Brussels to show how the illumination change throughout the day, every 30 minutes, from sunrise to sunset. The result is the following time series in a modelling clay-like terrain.
The Hillshades shown in the time series were created using a DEM and PostGIS. The visualization is done using QGIS.
Technical Recipe
DEM
We’re starting with the same DEM we used in a previous article.
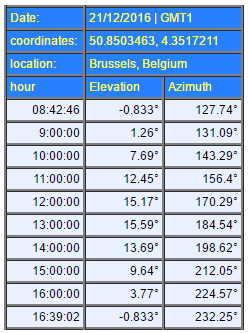
What are the sun’s azimuth and elevation at each hour of the day?
For knowing that, we use the http://www.sunearthtools.com/ website, which give us for Brussels on the 21st of December 2016.
Create the hillshades
The DEM is imported into a PostGIS database. There’s a special function within PostGIS for creating Hillshades. It is called ST_Hillshade. Using the Elevation and Azimuth values shown above, we generated a series of functions for showing the hillshade each 30 minutes, from sunrise to sunset.
DROP TABLE IF EXISTS hill_074246;
CREATE TABLE hill_074214 AS SELECT ST_HillShade(rast, 1, '8BUI', 127.74, 0, 255, 1.0, TRUE) rast
FROM brussels_dem_10m;
ALTER TABLE hill_074214 ADD COLUMN rid serial;
ALTER TABLE hill_074214 ADD CONSTRAINT hill_074214_pk PRIMARY KEY (rid);
CREATE INDEX hill_074214_gix ON hill_074214 USING GIST (st_convexhull (rast ) );
DROP TABLE IF EXISTS hill_080000;
CREATE TABLE hill_080000 AS SELECT ST_HillShade(rast, 1, '8BUI', 131.09, 1.26, 255, 1.0, TRUE) rast
FROM brussels_dem_10m;
ALTER TABLE hill_080000 ADD COLUMN rid serial;
ALTER TABLE hill_080000 ADD CONSTRAINT hill_080000_pk PRIMARY KEY (rid);
CREATE INDEX hill_080000_gix ON hill_080000 USING GIST (st_convexhull (rast ) );
[...]
Note: The hours used in the script are in UTC while those from the table are in local time.
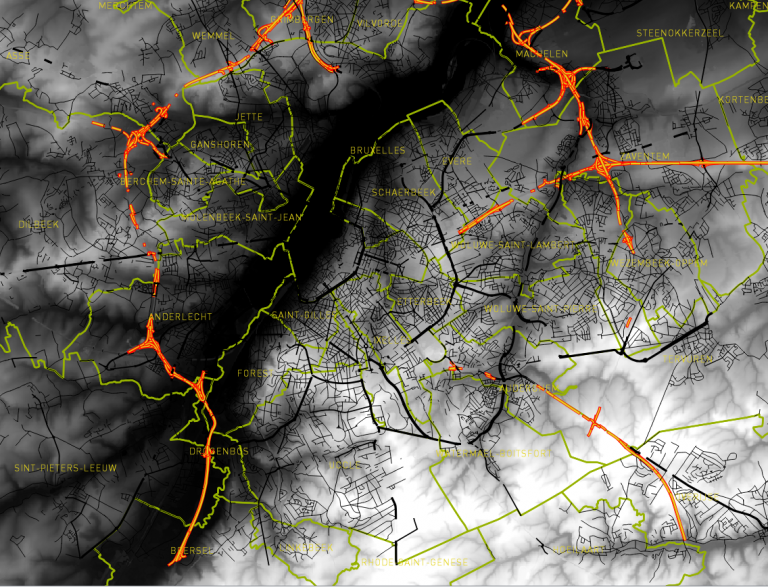
For the visualization in QGIS, we used a reverse greyscale: lowest values are in white while highest values are in black. If we do not do so, the modelling clay aspect of the terrain would seem like reversed: ridge lines look like valleys and valleys look like ridge lines.
Observations
Looking attentively to the variations in illumination throughout the day, we can observe how the angle of the incoming light plays on the shadow directions. This is especially true for the river system in the South East part of the scene.
Conclusions
With a DEM of the city of Brussels, with tools such as PostGIS and QGIS and with an ephemeris table, it is possible to create a series of Hillshade images showing the variation of the illumination every 30 minutes over the city of Brussels.
Cheers,
Daniel