

Posts by themagiscian:
- Pretoria (executive)
- Bloemfontein (judicial)
- Cape Town (legislative)
- What was your first map?
- At what age did you draw it?
- Can you post it here to share with the world?
- Platform setup (installation of ubuntu, VirtualBox)
- Database installation and setup (PostgreSQL/PostGIS, pgRouting)
- Data collection (OpenStreetMap)
- Data loading (PostGIS)
- Data preparation (PostGIS)
- Development of the algorithm (PostGIS)
- Server setup (Tomcat and Geoserver)
- Web app development (OpenLayers)
- Market Weight
- Market Capitalization
- Stock Evolution the last 5 years
- Average Daily Volume
- Earning Per Share in Euro
- P/E Ratio
- Percentage Change from Year Low
- Percentage Change from Year High
Capital cities in the centre of the country
May 3rd, 2016What makes a city a capital is more complicated than it seems. In most cases, the capital is the prime economic, cultural or intellectual centre that becomes the focal point of political power. This is the case for example for London, Madrid, Moscow, Rome, Beijin, Stockholm, Tokyo, and Vienna.
Cities which are disproportionately larger than any other city in the country, are called Primate Cities. Some examples: Accra, Athens, Belgrade, Bratislava, Brussels, Bucharest, Budapest, Buenos Aires, Bujumbura, Cairo, Copenhagen, Dublin, Kigali, Lima, Lisbon, London, Madrid, Manila, Montevideo, Mexico City, Nairobi, Paris, Prague, Riga, Santiago, Seoul, Skopje, Sofia, Stockholm, Tirana, Tokyo, Taipei, Ulaanbaatar, and Vienna.
All primate cities are however not always the capital. Ottawa, the capital of Canada, is not the country’s largest city. So it is for Washington DC (USA), Canberra (Australia), Brasilia (Brazil), Beijing (China), etc.
The capital city is often defined by constitution. De facto capital cities are, for example, such as Bern, Edinburgh, Lisbon, London, Paris, Wellington.
While most capital cities are chosen from an existing city, some countries have decided to create new cities to set their capital cities there. These cities are called “planned cities”. Here’s a list of planned capitals: La Plata, Buenos Aires Province, Argentina, Abuja, Nigeria (1991); Aracaju, Sergipe, Brazil (1855); Ankara, Turkey (1923); Austin, Texas, USA (1839); Belmopan, Belize (1970); Belo Horizonte, Minas Gerais, Brazil (1897); Dhaka, Bangladesh (1971); Brasília, Brazil (1960); Canberra, Australia (1927); Goiânia, Goiás, Brazil (1933); Indianapolis, Indiana, USA (1825); Islamabad, Pakistan (1960); Frankfort, Kentucky, USA (1792); Jefferson City, Missouri, USA (1821); Jhongsing New Village, Taiwan (1955); New Delhi, India (1911); Oklahoma City, Oklahoma, USA (1889); Ottawa, Ontario, Canada (1857); Palmas, Tocantins, Brazil (1989); Quezon City, Philippines (1948–76); Raleigh, North Carolina, USA (1792); Valletta, Malta (1571); Washington D.C., USA (1800); and Wellington, New Zealand (1865).
The reason for creating a new city as a capital can be overcrowding, the search for a better climate for the capital city, or a new city as a compromise between two competing cities. Canberra, for example, was created as Sydney and Melbourne competed for being Australia’s capital.
While the capital attracts political power, not all capitals are the seat of the country’s government. The Netherlands, which capital is Amsterdam, has its seat in The Hague. South Africa has three capitals:
There is also a case where a city is claimed as a capital by two countries. Jerusalem is both claimed by Israel and by Palestine.
Before continuing through the typology of capital cities, let’s go straight to the main topic of this article: are the capital located in the centre of their country? In other word, are they located at equal distance of all of their border? We could go from the hypothesis that a capital should be central as they minimize the distance from every point of the country. We know for sure that the population is not equally distributed in every country but from a geometric perspective, let’s find out how the capitals are located within their country!
Centroid or centre of bounding circle?
My first map: what is yours?
April 28th, 2016My very first time was a long time ago…
It sounds pathetic to start this way but my very first time was with pen and paper. Being born in the late 80’s, I had still the chance to practice a lot of my childhood with drawings. I remember: I was very enthouiastic and curious about a very lot of things: chemistry, physics, mathematics, science in general, astronomy but also football, sport, drawings, and the ubiquitous child curiosity: DINOSAURS! For those of you who could think my childhood was exclusively spent at home I reassure them: I was a sporty person as I practised 7 years football and I had a road bike I used a lot.
My interest in geography came very early. My christmas and birthdays gift were most of the times educational books unlike what my siblings got. Some of them were about the Earth, and talking about geography. Once I discovered it, I spent a lot of my time in the dictionnary at the pages tallking about places, countries, capital cities, volcanoes, tectonic plates, etc. I learnt the names of the capital cities of every country and I studied populations and the history about it.
I bought A0 posters on which I drew the countries I saw in the dictionnary (this is not good since there are copyrights, right, but which child cares?). I do however not remember which my first map was (this is the subject of the article right?).
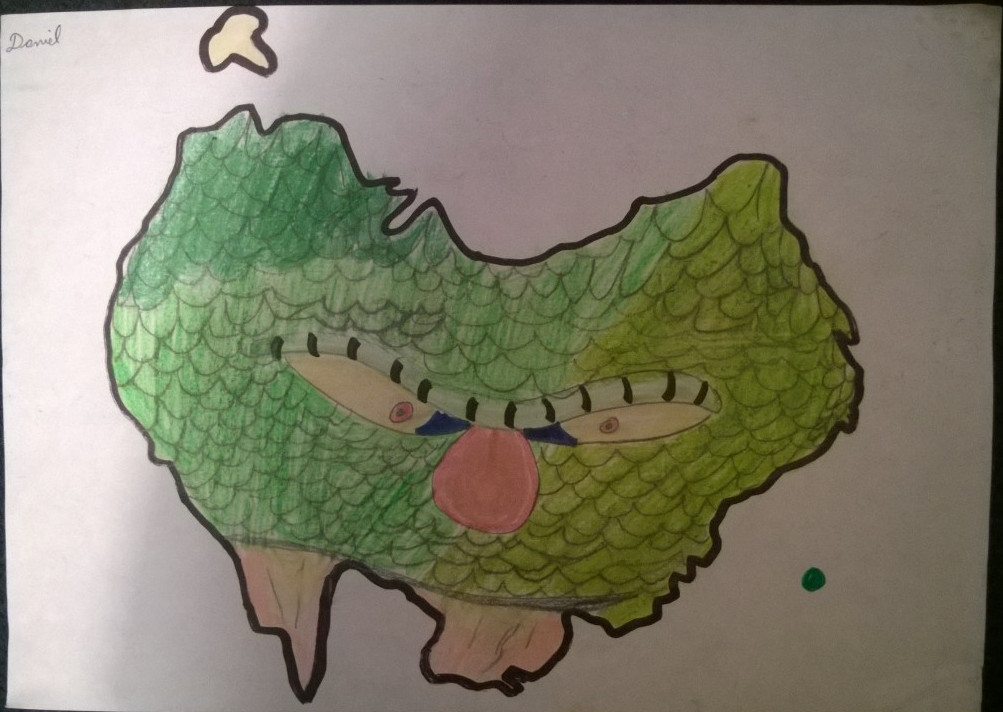
My first map
I recently found one of my first map ever drawn (see hereunder). I was recently in my father’s house looking inside my old beside table. It was full with souvenirs as I never emptied it when moving from home. I started rummaging in all the papers accumulated in my childhood until I found a particular drawing I made when I was about 10 years old (?). Unfortunately I did not put a date it. Only a signature in the top left is visible.
I remembered drawing a lot of these maps (or should we simply call it “drawings”?). Looking at it now 18 years later reminds me how creative I was, and how I did see the world as a child.
Can you guess which country it is?
Questions to you:
Cheers,
Daniel
Routing in Brisbane: a recipe for a complete web app
April 19th, 2016Routing
We use routing almost everyday. In the car, the GPS is our best friend. In public transportation we use the topological maps to find the quickest connections between point A and point B. Our mental maps allow us to get around traffic jam at known places.
For GPS especially, a lot of work is done upstream by engineers to make it possible to guide you through a city you do not know. Data has been collected, prepared and used in applications running on devices we call “GPS”, and which is almost mandatory to have in the car. With our today’s device, live traffic data are added into the algorithms to find the quickest (shortest? fastest?) route at any time of the day.
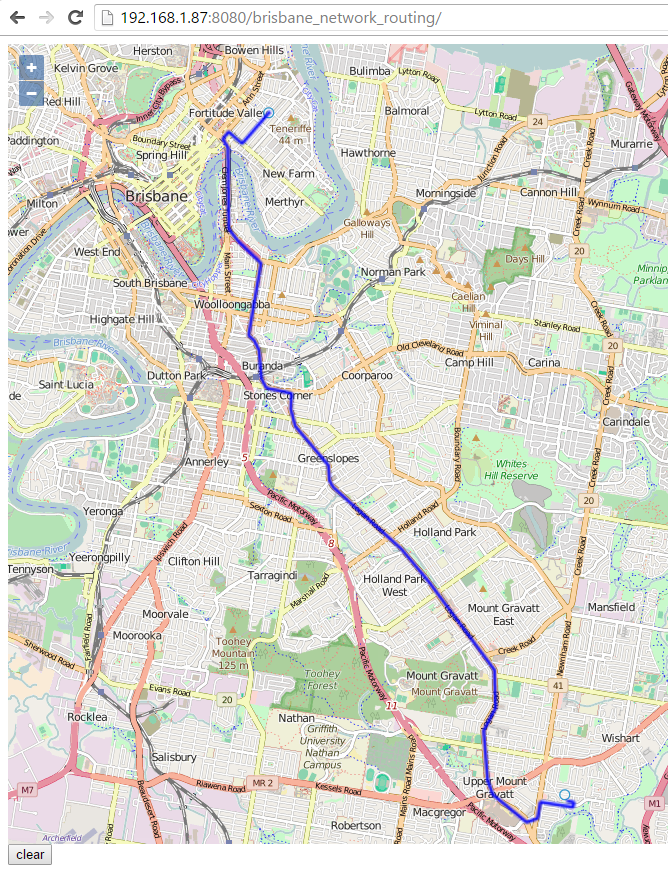
What about digging into this process and build our own routing application with (just) a small example?
In this article, we focus on the development of a routing web application that gives the fastest route between two points the user chooses. Our city lab this time is Brisbane, QLD, and the web app we’re going to create looks like this (see hereunder). Unfortunately, I do not have yet a public server where I could share my apps, so you have to get fine with only screenshots, *sorry*.
Using exclusively OpenSource data and products (except the host’s OS which is Windows 10 of course), the architecture we’ll built in this article looks like this.
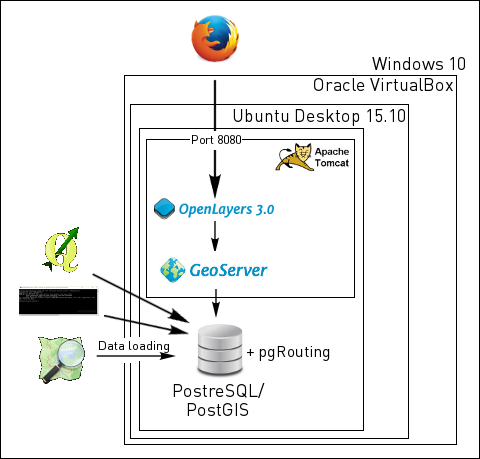
The project can be split into following stages:
Quick note: this article was inspired from the pgrouting workshop and can be followed by rookies as well as by a more advanced users.
Please find all the scripts I used in this article here: http://codes.themagiscian.com/osmrouting/
How did you discover our world with Google Earth?
April 13th, 2016Early days: How I discovered the Earth at my fingertips
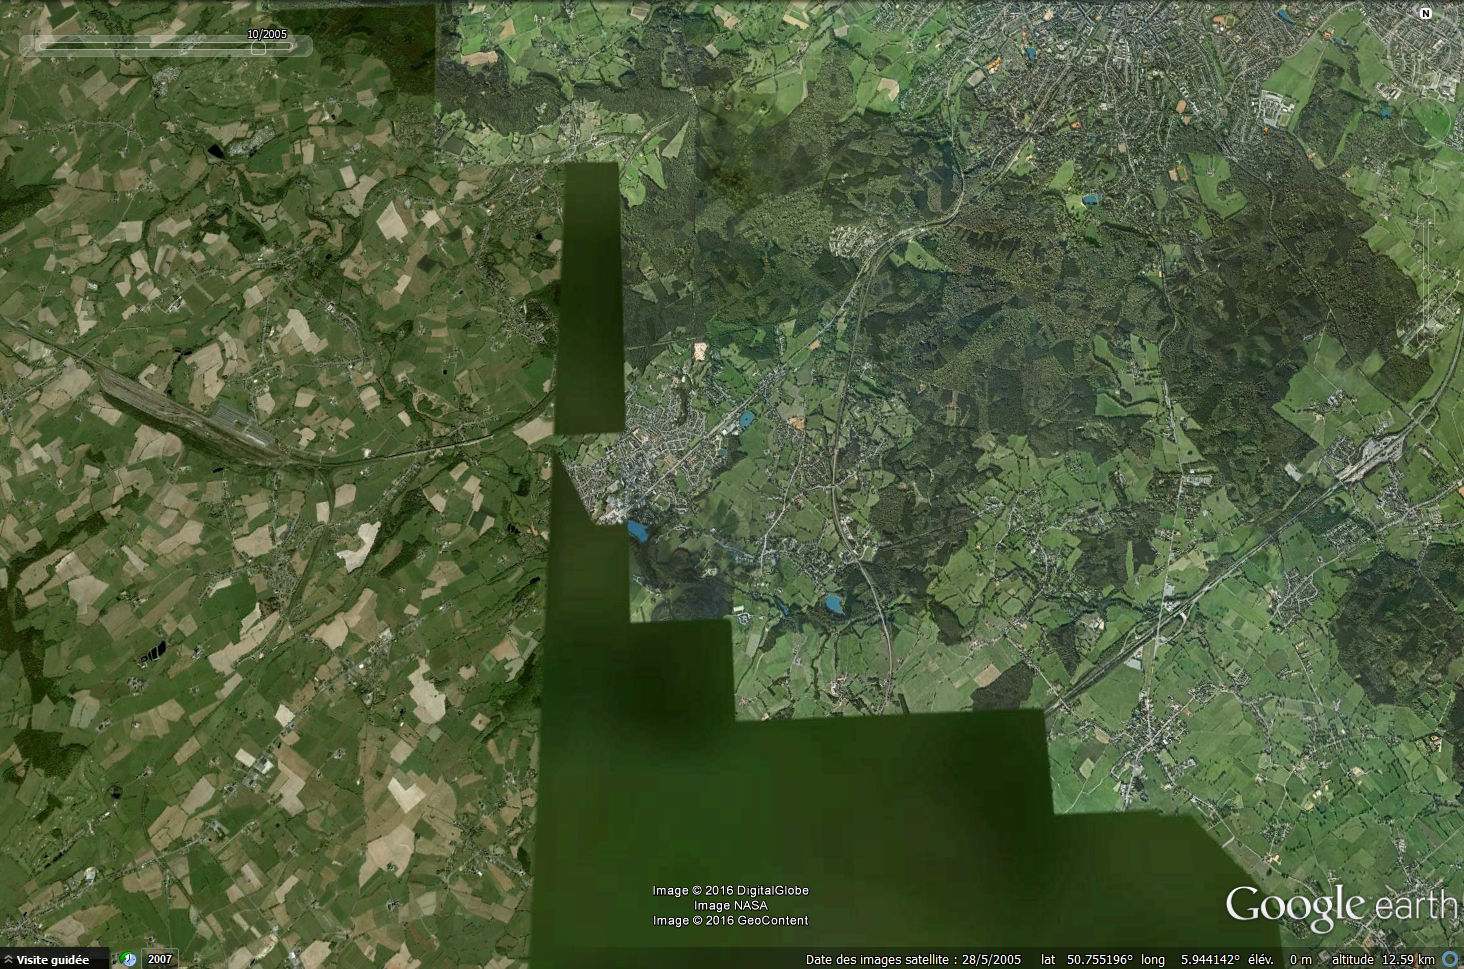
Rougly ten years ago, in 2005, my supervisor in the company I was working for as a student told me about the existence of Google Earth. He discovered it himself a while ago and he was surprized I never heard about it. Once back at home, my first reflex was to find, download and use this strange software I just heard from. At that time, my curiosity was just embryonic and I used the computer only for chatting as a young teenager. These software things were absolutely not my business at that time.
So I opened Google Earth and I rapidly zoomed to my area … and I discovered for the first time ever my village as flying over it by plane! Even though the images were not so accurate as they are today, I never saw “my world” like this and I recognized every single street and house in my village! I first zoomed to my house, then to the friends’s houses, to the grand-mother’s house, uncle and aunt houses. I zoomed in at every place I knew and I compared it with my own mental map. I discovered new areas in the village I was not aware of and surprisingly sometimes places just a few 100 meters away! There’s a small river flowing just a few meters behind the garden. I went all the way up to the source as I didn’t know from where this meandering water was coming from.
Molenbeek, Maalbeek, Schaarbeek. How many beek?
April 7th, 2016beek here, beek there …
Since terrorist attacks in Paris and in Brussels, the world learned the existence of some of the “beek” places in Brussels: Molenbeek, Maalbeek, Schaarbeek. The question that could come to mind is: Are there other “beek” in or around Brussels? Only around Brussels? What does this suffix mean?
Let’s discover it!
Belgium and the cultural influences
Belgium is a very small country in the Western part of Europe. It lies between The Netherlands, Germany, Luxembourg and France. Despite being so small – around 30 528 km²/11 787 sq mi or the size of Massachusetts – it has a marvelous cultural landscape and has successively received, along history, Celtic, Latin, Germanic, Saxon, Dutch, French and German influences.
These influences have shaped the toponyms (place names) and it is still possible today to retrace the origins of most names of villages and towns. The origins are often seen in the suffixes and this leads us to think that all places with similar suffixes have the same origin. This is often true but not always.
Most of the place names are nowadays very strongly influenced by the language region they are located in. Belgium has 3 national languages: Flemish (spoken in the Northern part of Belgium), French (spoken in the Southern part), and German (spoken in the Eastern part). Brussels is considered being bilingual (Flemish and French) but most of the inhabitants speak French.
In this articles, we will focus on the suffix –beek and language-influenced derivatives –bach –bais –baix –becq –beke.

Kelmis – Home sweet home
May 25th, 2015Kelmis is the village in Belgium I am coming from. I was born in Eupen but I lived the most part of my life in Kelmis (aka La Calamine in French). It is located at the border with The Netherlands and Germany and is hence a German-Speaking place where however almost everybody speaks French also.
As I am so proud of the place I come from, I decided to create a promotional Story Map about my village. It is rather small but there is a lot of history behind it.
For example, the 3.4km² locality of Neu-Moresnet in the municipality of Kelmis was formerly an independent State on its own from 1830 to 1919, with their own coins and stamps. There was also the Utopian project to make out of Neu-Moresnet the first State where Esperanto would have been a national language.
All of this being said, please discover this small town on your own:
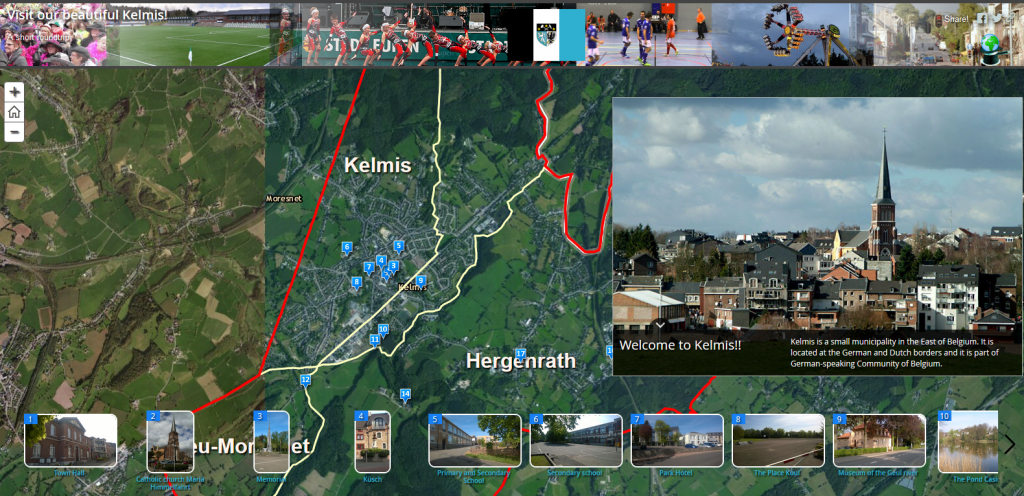
This app is built using the Story Map Tour os esri: http://storymaps.arcgis.com/.
IKEA Stores and their catchment areas in the Benelux countries
May 17th, 2015The catchment area of a store is its nearby surroundings where the customers are living. If we take into account the Reilly’s law of retail gravitation, “customers may be willing to travel longer distances to larger retail centers as long as they are large enough” (source:Wikipedia). This model supposes other constraints such as the area around the store being flat, there is no barriers (rivers, mountains, etc.), which is not the case in real life but the model can predict very interesting and accurate results anyway.
IKEA stores have proportionally bigger catchment areas. This is because the stores are big, there are a lot of choices of furnitures, they are cheap and of good quality, there is a good customer service, it also offers other services on place such as children playground, dining service, and there is a good delivery service as well.
So let just assume people are willing to spend a maximum of 30 minutes driving to the nearest IKEA. These 30-minute driving time, as well as the 10 and 20-minute driving time, are represented as isochrones (lines from where it takes the same amount of time to go to the same point). This is a common tasks performed in the geomarketing field to spot the customers on a map (but can also be used to spot the competitors!). CLICK on the image to get to the Web Application!
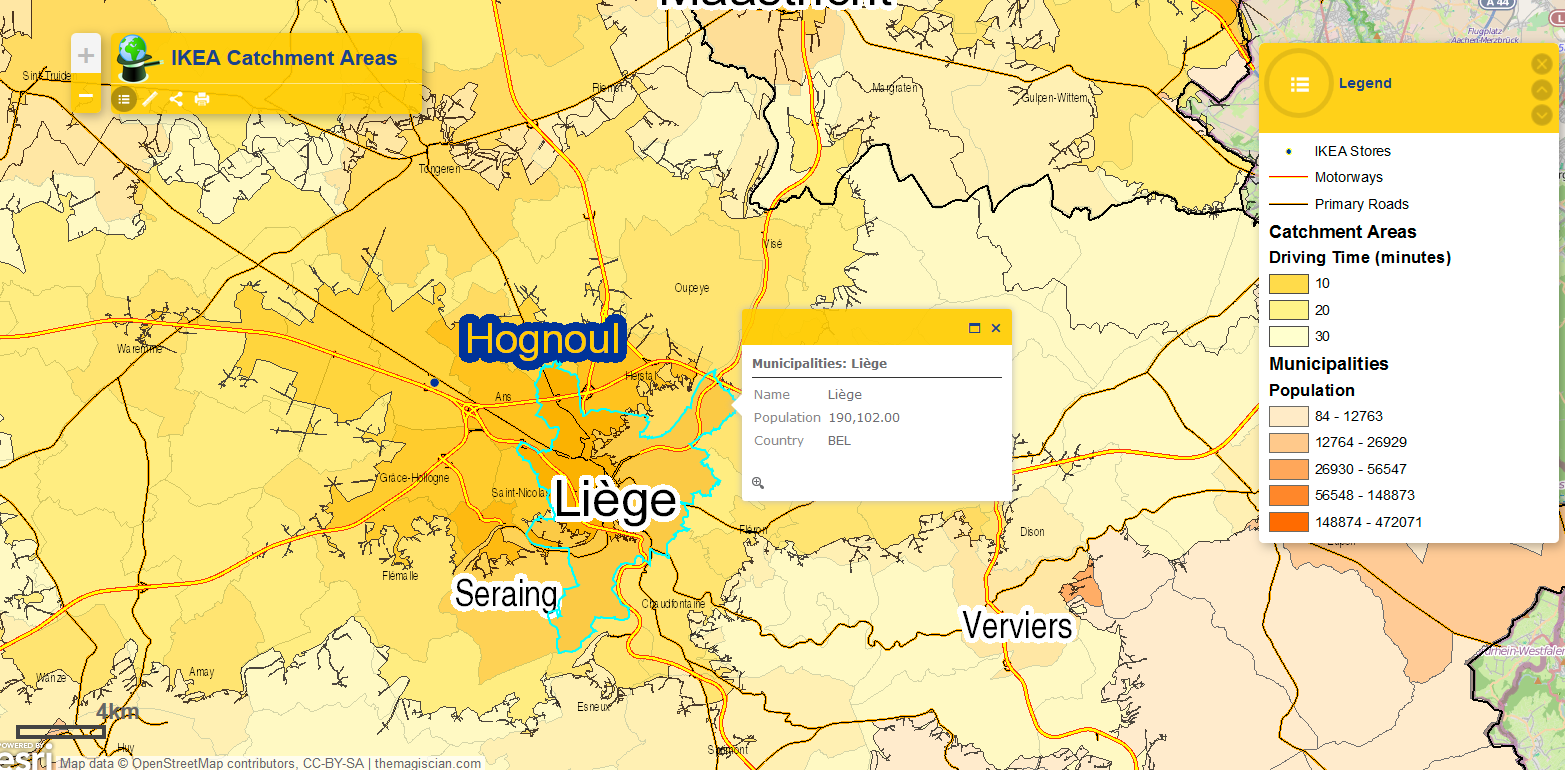
For the technical part, the road data used come from OpenStreetMap and the IKEA locations come from the IKEA website. The software used to perform all the calculations and the mapping part is ArcGIS for Desktop (with Network Analyst).
BEL20 Stock Market Index on maps
April 30th, 2015One of my hobbies beside GIS is following the Stock Market, whether it is the Belgian BEL20, the French CAC40, the Dutch AEX, the German DAX30 and of course the two American Dow Jones and NASDAQ.
The idea of this article was to merge both hobbies: The Stock Market and GIS. As a Belgian, my interest focuses on the BEL20 which is composed of following companies:
| Company | Sector | Address |
|---|---|---|
| AB InBev | Brewers | Boulevard Industriel 21 1070 Brussels |
| Ackermans & van Haaren | Diversified Industrials | Begijnenvest 113 B-2000 Antwerp |
| Ageas | Life Insurance | Markiesstraat 1 1000 Brussel |
| Befimmo-Sicafi | Industrial and Office REITs | Parc Goemaere Chaussée de Wavre 1945 B-1160 Brussels |
| Bekaert | Diversified Industrials | President Kennedypark 18 8500 Kortrijk |
| Belgacom | Telecommunications | Koning Albert II laan 27B 1030 Brussel |
| bpost | Postal Service | E.M.C. Building 829 C 1931 Zaventem |
| Cofinimmo | Industrial and Office REITs | Bld de la Woluwe 58 Woluwedal 1200 Brussels |
| Colruyt Group | Food Retailers and Wholesalers | Edingensesteenweg 196 1500 Halle |
| D'Ieteren | Consumer Services | Rue du Mail 50 1050 Ixelles |
| Elia | Electricity | Boulevard de l'Empereur 20 1000 Bruxelles |
| GBL | Specialty Finance | Avenue Marnix n°24 1000 Brussels |
| GDF Suez | Gas Distribution | Boulevard Simon Bolivar 1000 Ville de Bruxelles |
| Groupe Delhaize | Food Retailers and Wholesalers | Osseghemstraat 53 1080 St Jans-Molenbeek |
| Groupe Delta Lloyd | Insurances | Avenue de l'Astronomie 23 1210 Bruxelles |
| KBC | Banks | Havenlaan 2 B – 1080 Brussels |
| Solvay | Specialty Chemicals | RUE DE RANSBEEK 310 1120 BRUXELLES |
| Telenet Group | Broadcasting and Entertainment | Liersesteenweg 4 2800 Mechelen |
| UCB | Pharmaceuticals | Allée de la Recherche 60 1070 Anderlecht |
| Umicore | Specialty Chemicals | Broekstraat 31 1000 Brussel |
Obsiously, the companies are put on a map based on their addresses. To do the geocoding, I used the HERE geocoding API. The data used for producing the maps are coming from Google Finance and lecho.be. Data have been gathered on Sunday the 26th of April (so data are still outdated when writing this article).
All the maps I did can be visualized in the bel20 Stock Market Index Book (CLICK ON THE PICTURE):
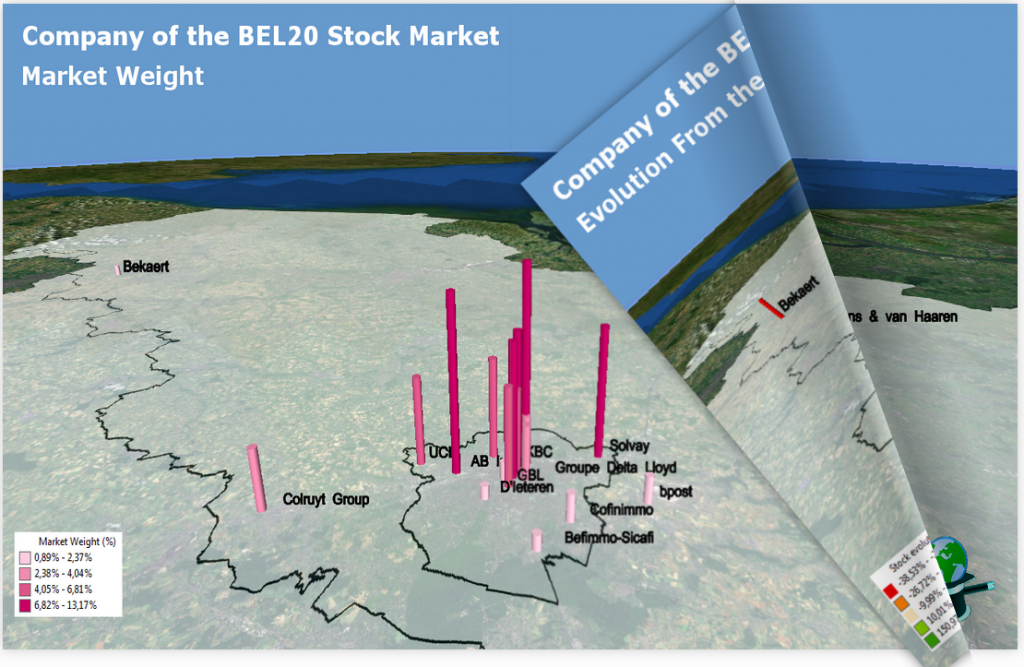
The maps were created within ArcGIS for Desktop. For each address point, I create a buffer with the purpose to extrude it according to a specific value. The document is then exported to ArcGlobe for giving the 3D perspective. The circles are extruded according to the parameters I chose:
As you will see in the following maps, the companies being part of the BEL20 index are principally located in Brussels. 5 of them are Flemish.
IMPORTANT NOTICE: This Article about combining GIS and the Stock Market has no purpose to give advise on buying or selling positions. This article is only an informative blog.
Here More Details about the individual maps:
Shortest Distance on the Mercator map- The Web App
April 21st, 2015Dear very value reader,
A long time ago, I published an article about the shortest path between two points on Earth. These are actually curved on a Mercator map and are definitely NOT straight lines. See this article to understand why it is so.
To make this concept of distorted paths more didactic, I decided to create a Google Maps application (the projection used by Google Maps is actually Web-Mercator, which is slightly different from the “real” Mercator):
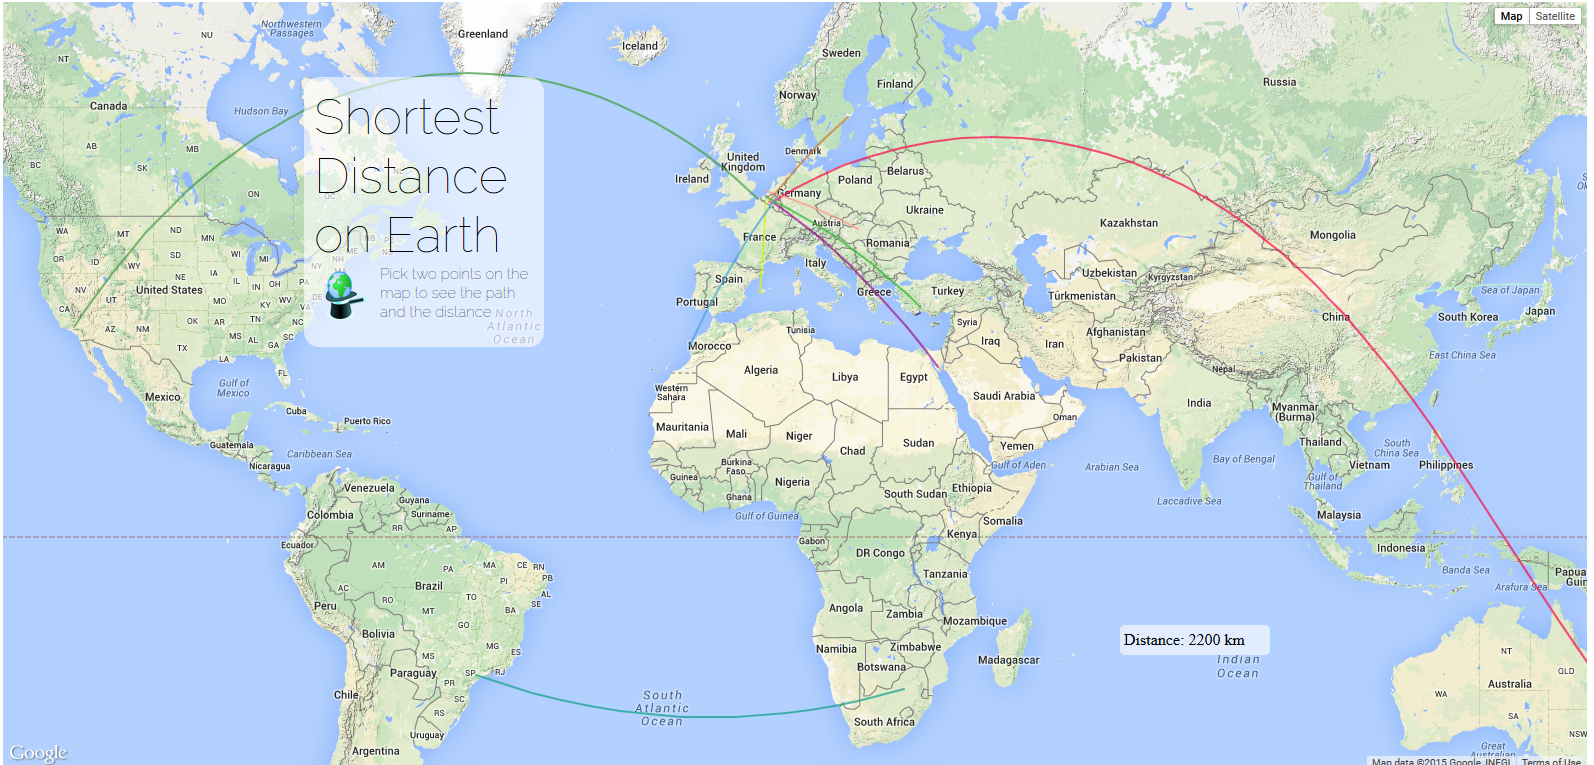
Feel free to play a bit around to discover the route that follows the shortest route between two points!
How is the app built?
MyEsri #devSummit 2015 Experience – Palm Springs, CA
April 8th, 2015In March, I attended the esri #devSummit, which took place in Palm Springs, CA. Three days full of Apps, Beer and Codes. It started with a great Plenary Session involving all the esri Superstars, the Product Managers, Jack and a surprise guest: will.i.am (http://arcg.is/1DEncdR).
Daniel GeoGeek